
Mathematics, 30.07.2021 04:50 aminamuhammad11
Applying a Level of Significance
In this task, you’ll study the data from two experiments. For each data set, you will determine whether the difference of means between the treatment group and the control group is statistically significant and interpret the result in the context of the situation.
Question 1
Researchers want to find a way to increase the growth rate of corn so it can be harvested more often. To test the effectiveness of a new type of spray fertilizer, plants grown from 200 corn seeds were divided equally into two groups: a treatment group and a control group. The treatment group was frequently sprayed with the new type of fertilizer. The growth in centimeters of each corn plant was noted before and after the treatment.
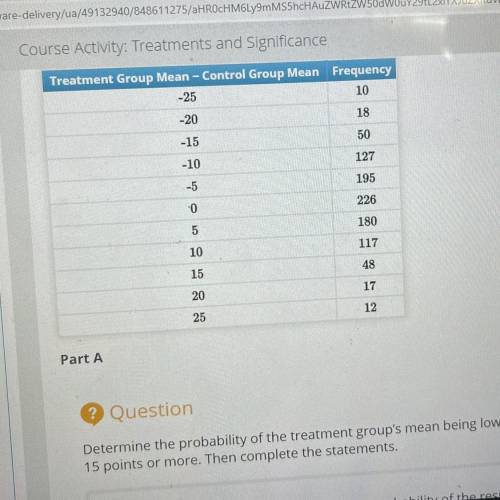
The results showed that the mean change in the growth rate by the treatment group is 8 points more than that of the control group. To test whether the results could be explained by random chance, researchers created a table that summarizes the results of 1,000 re-randomizations of the data with differences of means rounded to the nearest 2 points.
Consider the significance level to be set at 5%, so results less than 5% can be considered statistically significant.
Treatment Group Mean − Control Group Mean
Frequency
-12
1
-10
10
-8
28
-6
58
-4
125
-2
184
0
201
2
186
4
114
6
57
8
26
10
8
12
2
Part A
Question
Determine the probability of the treatment group’s mean being greater than the control group’s mean by 8 points or more. Then complete the statements.
The significance level is set at 5%, and the probability of the result is
2.6 5.9 5 1 3.6 %, which is less than greater than the same as the significance level. The result is statistically significant inconclusive not statistically significant .
Part B
Question
Which statement is true about the result considering a significance level of 5%?
The result is not statistically significant, which implies that this result could be due to random chance.
The result is statistically significant, which implies that spraying the corn plants with the new type of fertilizer does not increase the growth rate.
The result is statistically significant, which implies that spraying the corn plants with the new type of fertilizer does increase the growth rate.
The result is not statistically significant, which implies that spraying the corn plants with the new type of fertilizer does increase the growth rate.

Answers: 2


Another question on Mathematics
Mathematics, 21.06.2019 17:30
The following frequency table relates the weekly sales of bicycles at a given store over a 42-week period.value01234567frequency367108521(a) in how many weeks were at least 2 bikes sold? (b) in how many weeks were at least 5 bikes sold? (c) in how many weeks were an even number of bikes sold?
Answers: 2
Mathematics, 21.06.2019 17:30
If jaime wants to find 60% of 320, which table should he use?
Answers: 1
Mathematics, 21.06.2019 18:30
Can someone me do math because i am having a breakdown rn because i don’t get it
Answers: 1
Mathematics, 21.06.2019 18:30
Nick has box brads. he uses 4 brads for the first project. nick let’s b represent the original number of brads and finds that for the second project, the number of brads he uses is 8 more than half the difference of b and 4. write an expression to represent the number of brads he uses for the second project.
Answers: 3
You know the right answer?
Applying a Level of Significance
In this task, you’ll study the data from two experiments. For each...
Questions


Computers and Technology, 19.12.2019 02:31

Biology, 19.12.2019 02:31


