
Mathematics, 11.06.2020 01:57 breannaasmith1122
The accompanying data represent the total travel tax (in dollars) for a 3-day business trip in 8 randomly selected cities A normal probability plot suggests the data could come from a population that is normally distributed. A boxplot indicates there are no outliers. Complete parts through below.
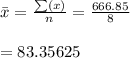
68.87 78.25 70.44 84.67 79.79 86.33 100.24 98.26
Click the icon to view the table of critical t-values.
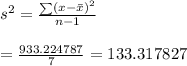
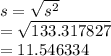
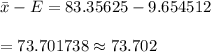
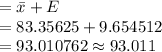
a. Determine a point estimate for the population mean travel tax A point estimate for the population mean travel tax is $ 83.36. (Round to two decimal places as needed.)
b. Construct and interpret a 95% confidence interval for the mean tax paid for a three-day business trip.
Select the correct choice below and fill in the answer boxes to complete your choice. (Round to two decimal places as needed.)
A. The lower bound is $ and the upper bound is $. One can be % confident that all cities have a travel tax between these values.
B. The lower bound is $ and the upper bound is $ The travel tax is between these values for % of all cities.
C. The lower bound is $ and the upper bound is $ There is a % probability that the mean travel tax for all cities is between these values.
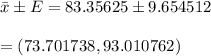
D. The lower bound is $ and the upper bound is One can be [95]% confident that the mean travel tax for all cities is between these values.
c. What would you recommend to a researcher who wants to increase the precision of the interval, but does not have access to additional data?
A. The researcher could decrease the level of confidence.
B. The researcher could decrease the sample standard deviation.
C. The researcher could increase the level of confidence.
D. The researcher could increase the sample mean

Answers: 2
 using t - dist
 ( from t - table , two tails, d.f =7)
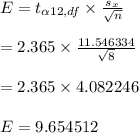


Another question on Mathematics
Mathematics, 21.06.2019 14:10
Given the function f(x) = log base 4(x+8) , find the value of f^-1(2)
Answers: 1
Mathematics, 21.06.2019 23:00
The areas of two similar triangles are 72dm2 and 50dm2. the sum of their perimeters is 226dm. what is the perimeter of each of these triangles?
Answers: 1
Mathematics, 21.06.2019 23:00
The weight of a radioactive isotope was 96 grams at the start of an experiment. after one hour, the weight of the isotope was half of its initial weight. after two hours, the weight of the isotope was half of its weight the previous hour. if this pattern continues, which of the following graphs represents the weight of the radioactive isotope over time? a. graph w b. graph x c. graph y d. graph z
Answers: 2
You know the right answer?
The accompanying data represent the total travel tax (in dollars) for a 3-day business trip in 8 ran...
Questions


Computers and Technology, 10.09.2019 23:10
Computers and Technology, 10.09.2019 23:10
Computers and Technology, 10.09.2019 23:10

Computers and Technology, 10.09.2019 23:20


