
Mathematics, 18.10.2021 01:30 nanakwameyeb
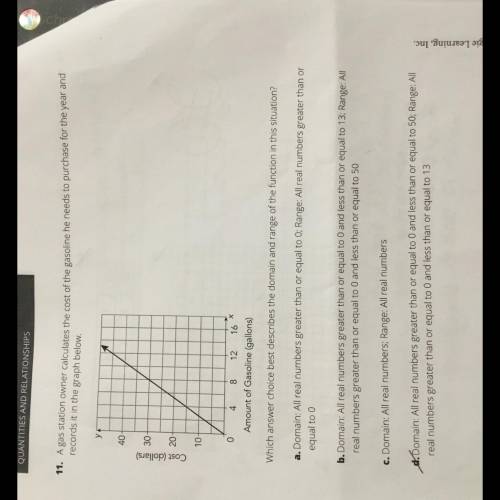
A gast station owner calculates the cost of the gasoline he needs to purchase for the year and records it in the graph below. Which answer choice best describes the domain and range of the function in this situation? a. Domain All real numbers greater than or equal to All real numbers greater than or equal to b. Domain All real numbers greater than or equal to 0 and less than or equal to 13, Range real numbers greater than equal to and less than or equal to 50 c. Domain All Real numbers Range All real numbers d. Domain All real numbers greater than or equal to and less than or equal to 50 Range All real numbers greater than or equal to and less than or equal to 13

Answers: 1


Another question on Mathematics
Mathematics, 21.06.2019 14:30
Simonne used the following steps to simplify the given expression. 12 - 3(-2x + 4) step 1: 12 + (–3)·(–2x) + (–3)·(4) step 2: 12 + 6x + (–12) step 3: 12 + (–12) + 6x step 4: 0 + 6x step 5: 6x what property of real numbers was used to transition from step 3 to step 4? a. identity property of addition b. inverse property of addition c. associative property of addition d. commutative property of addition
Answers: 1
Mathematics, 21.06.2019 16:00
Part one: measurements 1. measure your own height and arm span (from finger-tip to finger-tip) in inches. you will likely need some from a parent, guardian, or sibling to get accurate measurements. record your measurements on the "data record" document. use the "data record" to you complete part two of this project. name relationship to student x height in inches y arm span in inches archie dad 72 72 ginelle mom 65 66 sarah sister 64 65 meleah sister 66 3/4 67 rachel sister 53 1/2 53 emily auntie 66 1/2 66 hannah myself 66 1/2 69 part two: representation of data with plots 1. using graphing software of your choice, create a scatter plot of your data. predict the line of best fit, and sketch it on your graph. part three: the line of best fit include your scatter plot and the answers to the following questions in your word processing document 1. 1. which variable did you plot on the x-axis, and which variable did you plot on the y-axis? explain why you assigned the variables in that way. 2. write the equation of the line of best fit using the slope-intercept formula $y = mx + b$. show all your work, including the points used to determine the slope and how the equation was determined. 3. what does the slope of the line represent within the context of your graph? what does the y-intercept represent? 5. use the line of best fit to you to describe the data correlation.
Answers: 2
Mathematics, 21.06.2019 17:00
Let f(x)=2x and g(x)=2x. graph the functions on the same coordinate plane. what are the solutions to the equation f(x)=g(x) ?me asap
Answers: 2
Mathematics, 21.06.2019 21:00
Helena lost her marbles. but then she found them and put them in 44 bags with mm marbles in each bag. she had 33 marbles left over that didn't fit in the bags.
Answers: 3
You know the right answer?
A gast station owner calculates the cost of the gasoline he needs to purchase for the year and recor...
Questions


Mathematics, 09.07.2019 16:30

Computers and Technology, 09.07.2019 16:30
Mathematics, 09.07.2019 16:30


Mathematics, 09.07.2019 16:30
Mathematics, 09.07.2019 16:30
Mathematics, 09.07.2019 16:30
History, 09.07.2019 16:30

Social Studies, 09.07.2019 16:30
Social Studies, 09.07.2019 16:30
Social Studies, 09.07.2019 16:30


