Lesson 2: Data Representations
2.1: Notice and Wonder: Battery Life
The dot plot, histogram,...

Mathematics, 03.09.2021 19:50 btaylor1179
Lesson 2: Data Representations
2.1: Notice and Wonder: Battery Life
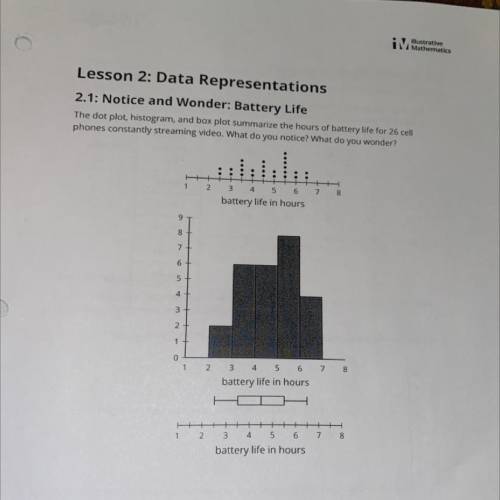
The dot plot, histogram, and box plot summarize the hours of battery life for 26 cell
phones constantly streaming video. What do you notice? What do you wonder?
.
.
c
1
2
7
8
3 4 5 6
battery life in hours
9
8
77
6 +
5 +
4 +
3
2.
1
0
1
2
3
4
5 6 7 8
battery life in hours
5
1
3
4
6
7 8
2
battery life in hours

Answers: 3


Another question on Mathematics
Mathematics, 21.06.2019 14:50
Which best describes the strength of the correlation, and what is true about the causation between the variables? it is a weak negative correlation, and it is not likely causal. it is a weak negative correlation, and it is likely causal. it is a strong negative correlation, and it is not likely causal. it is a strong negative correlation, and it is likely causal.
Answers: 1
Mathematics, 21.06.2019 15:00
7(x - 2) = 3(x + 4) solve the following equation. then enter your answer in the space provided using mixed number format.
Answers: 2
Mathematics, 21.06.2019 17:40
How can the correlation in the scatter plot graph below best be described? positive correlation negative correlation both positive and negative no correlation
Answers: 1
Mathematics, 21.06.2019 18:50
What are the values of a, b, and c in the quadratic equation 0 = x2 – 3x - 2? a = 1, b = 3, c = 2 a=, b = -3,c=-2 a = 1, b = 3, c= 2 a = 1.0= -3, c = 2
Answers: 2
You know the right answer?
Questions

History, 24.06.2021 03:20


Health, 24.06.2021 03:20

Mathematics, 24.06.2021 03:30

History, 24.06.2021 03:30

Mathematics, 24.06.2021 03:30
History, 24.06.2021 03:30
Mathematics, 24.06.2021 03:30

Spanish, 24.06.2021 03:30


