
Mathematics, 15.07.2021 19:40 shainaanderson24
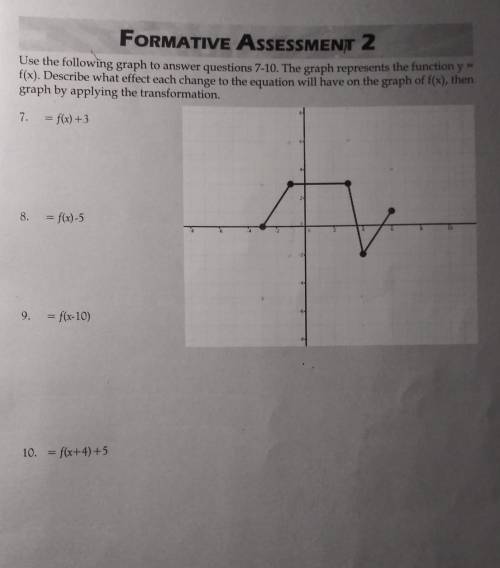
The graph represents the function y=f(x). Describe what effect each change to the equation will have on the graph of f(x), then graph by applying the transformation.
(the inserted pic is the graph that is used for these equations.)
1. = f(x) +3
2. = f(x) -5
3. =f(x-10)
4. = f(x+4)+5
Please be as informative as possible, and show step by step work. Thank you.

Answers: 1


Another question on Mathematics
Mathematics, 21.06.2019 12:50
Suppose the probability of selling a car today is 0.28. find the odds against selling a car today.
Answers: 3
Mathematics, 21.06.2019 15:10
Marcus needs to rewrite f(x) = x2 + 6x + 4 in vertex form.
Answers: 1
Mathematics, 21.06.2019 18:30
Iam a rectangle. my perimeter is 60 feet. how much are do i cover?
Answers: 1
Mathematics, 21.06.2019 19:30
The table below represents the displacement of a fish from its reef as a function of time: time (hours) x displacement from reef (feet) y 0 4 1 64 2 124 3 184 4 244 part a: what is the y-intercept of the function, and what does this tell you about the fish? (4 points) part b: calculate the average rate of change of the function represented by the table between x = 1 to x = 3 hours, and tell what the average rate represents. (4 points) part c: what would be the domain of the function if the fish continued to swim at this rate until it traveled 724 feet from the reef? (2 points)
Answers: 2
You know the right answer?
The graph represents the function y=f(x). Describe what effect each change to the equation will have...
Questions

Mathematics, 30.07.2019 08:00

Health, 30.07.2019 08:00
English, 30.07.2019 08:00


History, 30.07.2019 08:00


Business, 30.07.2019 08:00

Chemistry, 30.07.2019 08:00


