1. Find the value of the linear coefficient r,
COST 9 2 3 4 2 5 9 10
NUMBER 85 52 55 68 67 8...

Mathematics, 20.04.2021 05:30 nicolemaefahey
1. Find the value of the linear coefficient r,
COST 9 2 3 4 2 5 9 10
NUMBER 85 52 55 68 67 86 83 73
A. 0.708
B. 0.235
C. -0.071
D. 0.246
2. Give the linear coefficient r and the sample size n, determine the critical values of r and use your finding to state whether or not the given r represents a significant linear correlation. Use a significance level of 0.05.
r = 0.75, n = 9
A. Critical values r = +/-0.666, no significant linear correlation
B. Critical values r = = 0.666, no significant linear correlation
C. Critical values r = +/-0.666, significant linear correlation
D. Critical values r = -0.666, no significant linear correlation
3. Find the value of the linear correlation coefficient r.
TEMP 62 76 50 51 71 46 51 44 79
GROWTH 36 39 50 13 33 17 6 16
A. 0
B. 0.196
C. 0.256
D. -0.210
4. Suppose you will perform a test to determine whether there is sufficient evidence to support a claim of a linear correlation between two variables. Find the critical values of R given the number of pairs of data n and the significance level a.
n = 17, r = 0.05
A. r = 0.482
B. r = +/- 0.482
C. r = +/- 0.606
D. r = 0.497
5. Suppose you will perform a test to determine whether there is sufficient evidence to support a claim of a linear correlation between two variables. Find the critical values of R given the number of pairs of data n and the significance level a.
n = 14, a = 0.05
A. r = 0.553
B. r = 0.532
C. r = +/-0.532
D. r = +/- 0,661
6. Use the given data to find the equation of the regression line. Round the final values to three significant digits, if necessary.
X 3 5 7 15 16
Y 8 11 7 14 20
A. y = 4.07 + 0.753x
B. y = 5.07 + 0.850x
C. y = 4.07 + 0.850x
D. y = 5.07 + 0.753x
7. Use the given data to find the best predicted value of the response variable.
Ten pairs of data yield r = 0.003 and the regression equation y = 2 + 3x. Also, y bar = 5.0. What is the best predicted value of y for x = 2 Use a = 0.05.
A. 7.0
B. 17.0
C. 8.0
D. 5.0
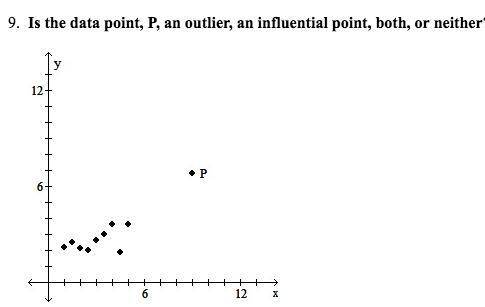
8. Is the data point, P, an outlier, an influential point, both, or neither?
A. Influential point
B. Neither
C. Outlier
D. Both
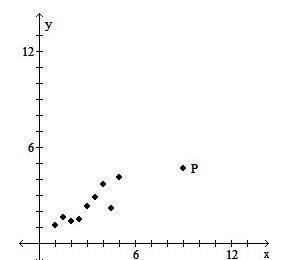
9. Is the data point, P, an outlier, an influential point, both, or neither?
A. Influential point
B. Neither
C. Outlier
D. Both
10. Use the given data to find the equation of the regression line. Round the final values to three significant digits, if necessary.
X 1 3 5 7 9
Y 143 116 100 98 90
A. y = -150.7 + 6.8x
B. y = 140.4 - 6.2x
C. y = -140.4 + 6.2x
D. 150.7 - 6.8x
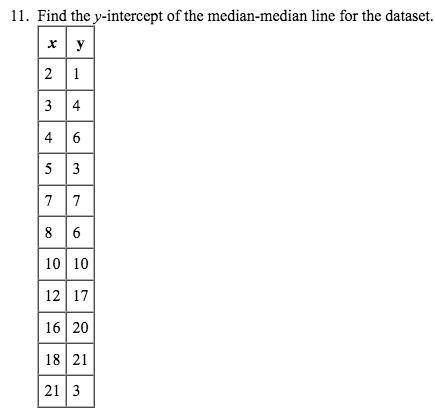
11. Find the y-intercept of the median-median line for the dataset.
A. b = -0.8889
B. b = 1
C. b = 1.1111
D. b = 1.1481
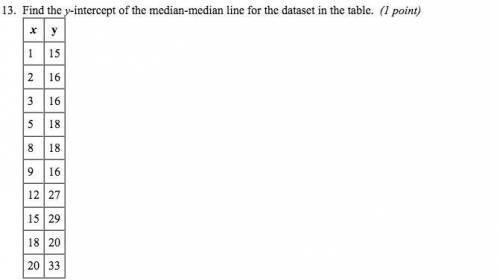
13. Find the y-intercept of the median-median line for the dataset in the table.
A. 6.5
B. 13.3
C. 16.3
D. 10.2
14. The median-median line for a dataset is y = 1.4x + 2.6.
The least-squares regression line for the same dataset is y = 0.9 + 4.2. Which regression equation better predicts the y-value for the point (10, 14)?
A. The median-median line is a better prediction.
B. The least-squares regression line is a better prediction.
C. The models predict the same value.
D. The models predict different values that are equally inaccurate.
15. What is the slope of the median-median line for the dataset in this table?
A. m = -2.5278
B. m = -1.1333
C. m = 1.0833
D. m = 8.4722
16. Construct a scatterplot and identify the mathematical model that best fits the data. Assume the model is to be used only for the scope of the given data and consider only linear, quadratic, logarithmic, exponential, and power models. Use a calculator or computer to obtain the regression equation of the model that best fits the data. You may need to fit several models and compare the values of R^2.
X 1 4 5 9 11 16
Y 9 13 50 300 2000 50000
A. y = 2.35 e^1.82x
B. y = 477.5x^2 - 5269.4x + 9334.1
C. y = 1.69x^2.86
D. y = -10298.6 + 11016 ln x
17. A collection of paired data consists of the number of years that students have studied Spanish and their scores on a Spanish language proficiency test. A computer program was used to obtain the least squares linear regression line and the computer output is shown below. Along with the paired sample data, the program was also given an x value of 2 (years of study) to be used for predicting test scores.
Equation: y = mx + b
Statistics
r^2 = 0.83
r = 0.91
Parameters
m = 10.90
b = 31.55
Answer the following questions based on the information given above.
Use the information in the display to find the value of the linear correlation coefficient r. Determine whether there is significant linear correlation between years of study and test scores. Use a significance level of 0.05. There are 10 pairs of data.
A. r = 0.83; There is no significant linear correlation.
B. r = 0.91; There is no significant linear correlation.
C. r = 0.91; There is significant linear correlation.
D. r = 0.83; There is significant linear correlation.

Answers: 2


Another question on Mathematics
Mathematics, 21.06.2019 12:50
Asequence of numbers begins with 12 and progresses geometrically. each number is the previous number divided by 2. which value can be used as the common ratio in an explicit formula that represents the sequence? 1/2 2 6 12
Answers: 3
Mathematics, 21.06.2019 13:30
1. the following set of data represents the number of waiting times in minutes from a random sample of 30 customers waiting for service at a department store. 4 5 7 10 11 11 12 12 13 15 15 17 17 17 17 17 18 20 20 21 22 22 23 24 25 27 27 31 31 32 a. determine the number of classes and class interval.
Answers: 3
Mathematics, 21.06.2019 16:30
An empty bucket is placed under a faucet dripping at a constant rate of 4 milliliters per minute. with the given information, which of these statements is a reasonable conclusion? a there will be 24 milliliters of water in the bucket after 16 hour. b there will be 60 milliliters of water in the bucket after 14 hour. c there will be 160 milliliters of water in the bucket after 20 minutes. d there will be 100 milliliters of water in the bucket after 40 minutes.
Answers: 1
You know the right answer?
Questions

Chemistry, 14.05.2021 16:50

Biology, 14.05.2021 16:50

Mathematics, 14.05.2021 16:50
Spanish, 14.05.2021 16:50
Mathematics, 14.05.2021 16:50

Mathematics, 14.05.2021 16:50
English, 14.05.2021 16:50
Mathematics, 14.05.2021 16:50
Chemistry, 14.05.2021 16:50

History, 14.05.2021 16:50
Mathematics, 14.05.2021 16:50

Mathematics, 14.05.2021 16:50
Mathematics, 14.05.2021 16:50


