Please answer. The graph of a linear function of x is shown below.
F(x)
50
40
30<...

Mathematics, 24.03.2021 01:30 coreycbg1127
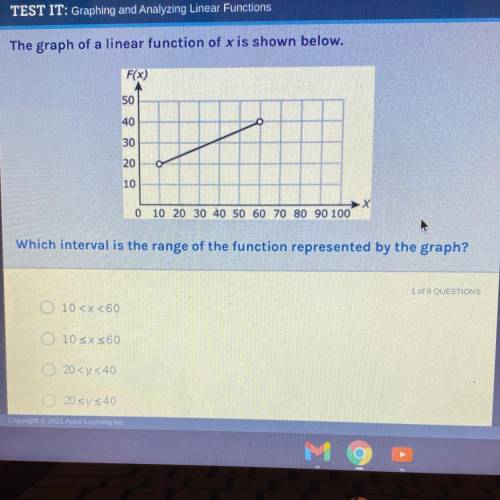
Please answer. The graph of a linear function of x is shown below.
F(x)
50
40
30
20
10
0 10 20 30 40 50 60 70 80 90 100
Which interval is the range of the function represented by the graph?
1 of 8 QUESTIONS
010
10 sx 560
20
© 20 sy s 40
Copy

Answers: 2


Another question on Mathematics
Mathematics, 21.06.2019 17:20
Match the equivalent expressions. x - 3y + 12 12 - 3y - 2x + x + 2x 3x + 2y - 2x + y + 12 3y + 12 3x + y - 12 4y + 3y + 3x - 6y - 10 - 2 x + 3y + 2x - 3x + 7 + 5 x + 3y + 12 5 + 2y + 7x - 4x + 3y - 17
Answers: 1
Mathematics, 21.06.2019 22:00
Rewrite so the subject can be y in the formula d=m-y/y+n
Answers: 1
Mathematics, 21.06.2019 22:10
Find the volume of the solid whose base is the region bounded by f(x), g(x) and the x-axis on the interval [0, 1], and whose cross-sections perpendicular to the y-axis are squares. your work must show the integral, but you may use your calculator to evaluate it. give 3 decimal places for your answe
Answers: 3
You know the right answer?
Questions
Mathematics, 08.01.2021 07:50

English, 08.01.2021 07:50
Mathematics, 08.01.2021 07:50
Mathematics, 08.01.2021 07:50

Social Studies, 08.01.2021 07:50

Health, 08.01.2021 07:50


Mathematics, 08.01.2021 07:50
Social Studies, 08.01.2021 07:50

Mathematics, 08.01.2021 07:50


