
Mathematics, 08.12.2020 05:50 casie65
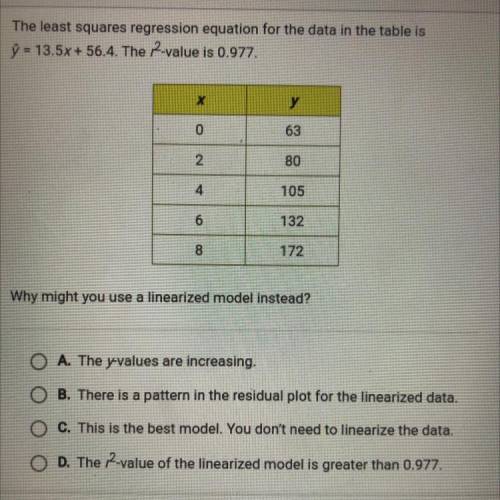
The least squares regression equation for the data in the table is
ỹ = 13.5x + 56.4. The 2-value is 0.977.
х
у
0
63
2.
80
4
4
105
6
132
00
172
Why might you use a linearized model instead?
A. The y-values are increasing.
B. There is a pattern in the residual plot for the linearized data.
C. This is the best model. You don't need to linearize the data.
D. The 2-value of the linearized model is greater than 0.977.
pls help!

Answers: 1


Another question on Mathematics
Mathematics, 21.06.2019 17:30
Find the zero function by factoring (try to show work) h(x)=-x^2-6x-9
Answers: 2
Mathematics, 21.06.2019 22:00
1) prove that 731^3−631^3 is divisible by 100 2) prove that 99^3−74^3 is divisible by 25
Answers: 2
Mathematics, 21.06.2019 22:00
15 points what is the end behavior of this graph? & what is the asymptote of this graph?
Answers: 1
Mathematics, 21.06.2019 23:10
Tom travels between the two mile markers shown and then finds his average speed in miles per hour. select the three equations that represent this situation.
Answers: 1
You know the right answer?
The least squares regression equation for the data in the table is
ỹ = 13.5x + 56.4. The 2-value i...
Questions


Biology, 28.06.2019 21:00

Mathematics, 28.06.2019 21:00


Social Studies, 28.06.2019 21:00

Business, 28.06.2019 21:00
English, 28.06.2019 21:00
Biology, 28.06.2019 21:00


