The bar graph shows the average annual spending per
person on selected items in 2010.
The com...

Mathematics, 08.11.2020 03:10 kitttimothy55
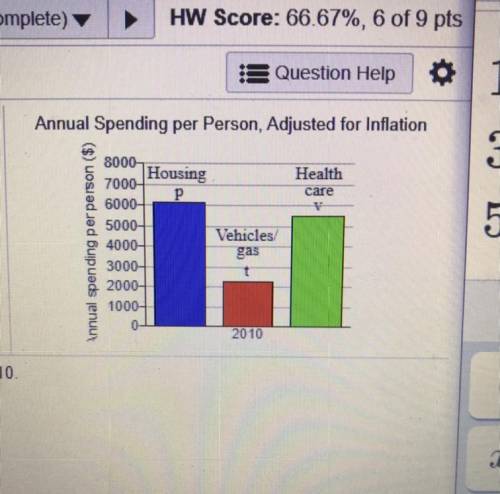
The bar graph shows the average annual spending per
person on selected items in 2010.
The combined spending on housing, vehicles/gas, and
health care was $13,883. The difference between
spending on housing and spending on vehicles/ga
s was
$3846. The difference between spending on housing
and spending on health care was $592.
Find the average per-person spending on housing in 2010

Answers: 3


Another question on Mathematics
Mathematics, 21.06.2019 19:30
Arestaurant chef made 1 1/2 jars of pasta sauce. each serving of pasta requires 1/2 of a jar of sauce. how many servings of pasta will the chef be able to prepare using the sauce?
Answers: 1
Mathematics, 21.06.2019 20:20
Recall that the owner of a local health food store recently started a new ad campaign to attract more business and wants to know if average daily sales have increased. historically average daily sales were approximately $2,700. the upper bound of the 95% range of likely sample means for this one-sided test is approximately $2,843.44. if the owner took a random sample of forty-five days and found that daily average sales were now $2,984, what can she conclude at the 95% confidence level?
Answers: 1
Mathematics, 21.06.2019 21:00
Solve this problem! extra ! 3025/5.5 = a/90.75 / = fraction
Answers: 3
Mathematics, 21.06.2019 21:30
Consider circle c with angle acb measuring 3/4 radians.if minor arc ab measures 9 inches, what is the length of the radius of circle c? if necessary, round your answer to the nearest inch.
Answers: 2
You know the right answer?
Questions

Mathematics, 27.07.2019 08:30
Mathematics, 27.07.2019 08:30

Mathematics, 27.07.2019 08:30

Social Studies, 27.07.2019 08:30


Physics, 27.07.2019 08:30
Mathematics, 27.07.2019 08:30
English, 27.07.2019 08:30
Mathematics, 27.07.2019 08:30

Mathematics, 27.07.2019 08:30
History, 27.07.2019 08:30


