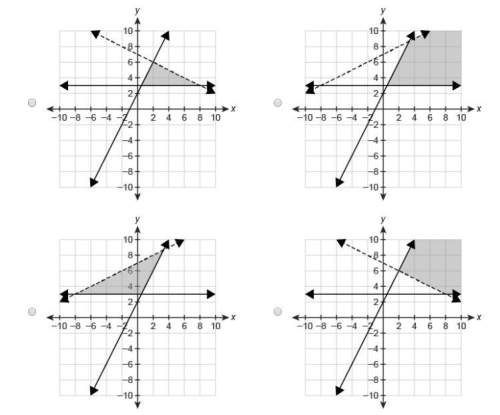
Which graph represents the solution set to the system of inequalities?
y≤2x+2, 1/2x+y&l...

Mathematics, 23.10.2019 02:00 aisha82
Which graph represents the solution set to the system of inequalities?
y≤2x+2, 1/2x+y< 7, y−3≥0

Answers: 3


Another question on Mathematics
Mathematics, 21.06.2019 14:30
Which system of linear inequalities is represented by the graph?
Answers: 2
Mathematics, 21.06.2019 22:30
The party planning committee has to determine the number of tables needed for an upcoming event. if a square table can fit 8 people and a round table can fit 6 people, the equation 150 = 8x + 6y represents the number of each type of table needed for 150 people.
Answers: 1
You know the right answer?
Questions


