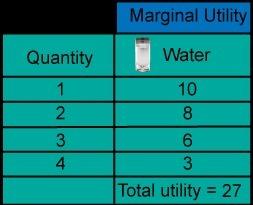
Which scenario does this graph illustrate?
companies need to maximize production, so th...

Business, 29.10.2019 20:31 bellaisbored202
Which scenario does this graph illustrate?
companies need to maximize production, so they will produce less and charge more.
companies want to make money, so they increase production as price increases.
consumers need to spend wisely, so they will purchase more goods at a lower cost.
consumers want a good deal and will pay more money for a quality product.

Answers: 1


Another question on Business
Business, 22.06.2019 09:40
Newton industries is considering a project and has developed the following estimates: unit sales = 4,800, price per unit = $67, variable cost per unit = $42, annual fixed costs = $11,900. the depreciation is $14,700 a year and the tax rate is 34 percent. what effect would an increase of $1 in the selling price have on the operating cash flow?
Answers: 2
Business, 22.06.2019 13:50
Suppose portugal has 700 workers and 26,000 units of capital, and france has 18,000 workers and 700 units of capital. technology is identical in both countries. assume that wine is the capital-intensive good and cloth is the labor-intensive good. which of the following statements is correct if the nations start trading with each other? a) wages will increase in portugal.b) rental rates in france will increase.c) wages in france will decrease.d) rental rates in portugal will increase.
Answers: 2
Business, 22.06.2019 15:10
On december 31, 2013, coronado company issues 173,000 stock-appreciation rights to its officers entitling them to receive cash for the difference between the market price of its stock and a pre-established price of $10. the fair value of the sars is estimated to be $5 per sar on december 31, 2014; $2 on december 31, 2015; $10 on december 31, 2016; and $8 on december 31, 2017. the service period is 4 years, and the exercise period is 7 years. prepare a schedule that shows the amount of compensation expense allocable to each year affected by the stock-appreciation rights plan.
Answers: 2
Business, 22.06.2019 20:50
Lead time for one of your fastest-moving products is 20 days. demand during this period averages 90 units per day.a) what would be an appropriate reorder point? ) how does your answer change if demand during lead time doubles? ) how does your answer change if demand during lead time drops in half?
Answers: 1
You know the right answer?
Questions

Chemistry, 10.07.2019 03:30


Social Studies, 10.07.2019 03:30

History, 10.07.2019 03:30
History, 10.07.2019 03:30

Computers and Technology, 10.07.2019 03:30
Computers and Technology, 10.07.2019 03:30
Computers and Technology, 10.07.2019 03:30
Computers and Technology, 10.07.2019 03:30
Social Studies, 10.07.2019 03:30
Social Studies, 10.07.2019 03:30
History, 10.07.2019 03:30


