
Social Studies, 25.05.2021 18:50 hussain34
Graph is the image below
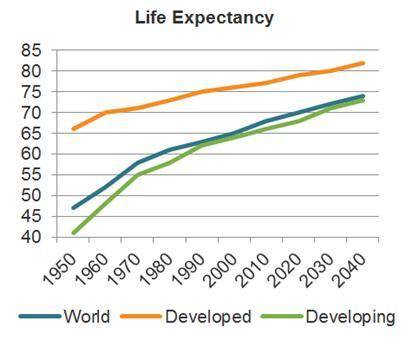
Line graph showing life expectancy in years of age. A green line marks developing countries. An orange line is developed countries and a blue line is the world. Years are 1950 to 2040. Ages start at 40 and end at 85.
According to this graph, what is the life expectancy for a child born in the United States in 1990?
about 75
about 80
According to this graph, which region has made the greatest gains in life expectancy since 1950?
the world
developing nations

Answers: 1


Another question on Social Studies
Social Studies, 22.06.2019 01:20
Gettysburg address question. what is the best line from the address? why do you think so?
Answers: 1
Social Studies, 22.06.2019 11:00
Though most presidents have claimed affiliation with a christian church, the only roman catholic president has been a) abraham lincoln. b) john f. kennedy. c) george washington. d) franklin d. roosevelt.
Answers: 1
Social Studies, 22.06.2019 12:10
Those with high self-esteem are highly critical of their strengths and weaknesses. true or false
Answers: 1
Social Studies, 23.06.2019 08:30
Many scholars and observers have argued that the ratification of the fourteenth amendment to the constitution has become the single most important act in all of united states politics. (a) identify which provision of the fourteenth amendment was applied to the following supreme court cases. for each case, explain the significance of the decision in united states politics. ' mapp v. ohio (1961) ' gideon v. wainwright (1963) (b) identify which provision of the fourteenth amendment was applied to the following supreme court cases. for each case, explain the significance of the decision in united states politics. ' brown v. board of education (1954) ' baker v. carr (1962) ' regents of the university of california v. bakke (1978)
Answers: 3
You know the right answer?
Graph is the image below
Line graph showing life expectancy in years of age. A green line marks dev...
Questions

Mathematics, 05.12.2019 03:31
Mathematics, 05.12.2019 03:31


Mathematics, 05.12.2019 03:31

Mathematics, 05.12.2019 03:31
English, 05.12.2019 03:31
Mathematics, 05.12.2019 03:31
Mathematics, 05.12.2019 03:31
Mathematics, 05.12.2019 03:31


