What does this graph represent?
a.
The number of video games played in year.
b.
W...

Social Studies, 25.09.2020 16:01 walkerobrien5
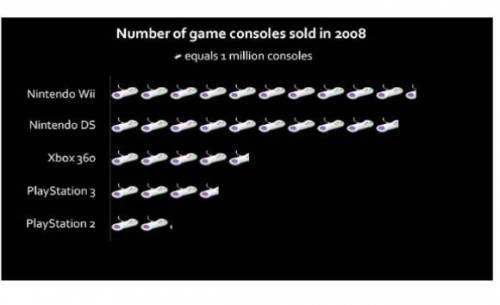
What does this graph represent?
a.
The number of video games played in year.
b.
Which video games are played.
c.
Who bought video systems.
d.
Which video games systems were purchased in 2008.
Please select the best answer from the choices provided
A
B
C
D

Answers: 1


Another question on Social Studies
Social Studies, 22.06.2019 04:30
What is the relationship between surface winds in the northern and southern hemisphere?
Answers: 1
Social Studies, 22.06.2019 14:30
During the period from 1865 to 1898 how did the political/economic elite contain the demands of farmers and laborers for economic justice
Answers: 1
Social Studies, 22.06.2019 20:30
Imperial crisis inflation invasion pax romana great schismtrade during the , roman generals warred over succession. these conflicts drew soldiers away from the frontier and made the empire vulnerable to
Answers: 1
Social Studies, 23.06.2019 13:00
As a child ages, the importance of their peer group as an agent of socialization does which of the following? ✓increases decreases remains the same none of the above
Answers: 1
You know the right answer?
Questions


English, 21.12.2020 17:50

Arts, 21.12.2020 17:50


