Answer the questions based off the graph.
1. What is shown on the X axis of this graph?
A. T...

SAT, 03.12.2021 07:00 jadalawler3
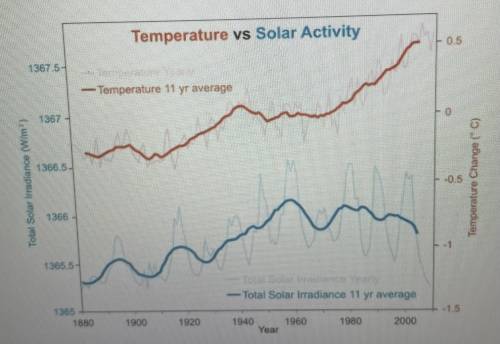
Answer the questions based off the graph.
1. What is shown on the X axis of this graph?
A. Temperature Change B. Year C. Solar irradiance or. D. Temperature vs solar activity
2. What is the average temperature reading in (oC) for the year 2000? (This is an estimate choose the number that would be closest)
A.-0.75. B.-0.49 C.0.5 or D.0.55
3.What year is tempature change average at its highest?
A. 1960 B. 1940 c. 2000 or d.1980
4. What year is solar irradiance at its highest?
A.1960
B.1940
C.2000
D.1980
Answers: 3


Another question on SAT
SAT, 23.06.2019 04:50
If (a, b) is the solution to the system of equations shown above, and a and b are integers, then what is the value of a+b?
Answers: 3
SAT, 26.06.2019 13:00
What undergraduate degree can a student earn at a four-year college (not specific to a field of study)?
Answers: 1
SAT, 26.06.2019 18:30
After studying french for 5 yearscin school, i was shocked to discover when i went to france that i couldn't even get a glass of water without a lot of sign language what is the author main point
Answers: 1
You know the right answer?
Questions

English, 03.10.2019 10:50


Mathematics, 03.10.2019 10:50
Mathematics, 03.10.2019 10:50
Mathematics, 03.10.2019 10:50

Mathematics, 03.10.2019 10:50

Spanish, 03.10.2019 11:00

Biology, 03.10.2019 11:00


