Fill in the table below based on the global temperature record:
Time period Number of yea...

Physics, 05.05.2020 16:29 1232444553
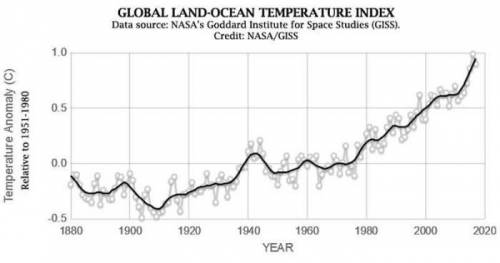
Fill in the table below based on the global temperature record:
Time period Number of years with mean Temp. > 0° to +1° above mean Number of years with mean Temp. more than +1° above mean Number of years with mean Temp. < 0° to -1° below mean
1880-1899 0 0 20
1900-1919
1920-1939
1940-1959
1960-1979
1980-1999
2000-2019
Have global temperatures risen or fallen since 1900, and how much have they changed (how many temperature degrees) .
What is the size of the overall temperature changes in USA (how many degrees has it changed, see previous graph!) and how does this compare to the size of the global temperature change calculated in the previous question?
Are the years with the highest and lowest annual temperatures the same on both graphs (are the same in the USA versus in the world)? If not how much do they differ?
Are the points with the highest and lowest 5 year average temperatures the same on both graphs? If not how much to they differ (i. e. how much time is there between them)?
Suggest a reason why mean annual temperature in USA may differ from mean global temperature. (Hint: think about USA’s geographic position on earth, how is USA different from the average values you would get looking at all of earth, what’s special about it)

Answers: 3


Another question on Physics
Physics, 21.06.2019 21:00
In the 1980's, congress authorized the u.s. department of energy to build the wipp facility in the chicuahuan desert in new mexico. what is the purpose of wipp?
Answers: 2
Physics, 22.06.2019 05:00
Aperson walking 1 mile everyday for exercise, leaving her front porch at 9: 00 am and returning to her front porch at 9: 25 am. what is the total displacement of her daily walk? a) 1 mileb) 0c) 25 minutes d) none of the above
Answers: 1
Physics, 22.06.2019 17:30
Aball thrown by ginger is moving upward through the air. diagram a shows a box with a downward arrow. diagram b shows a box with an upward arrow. diagram c shows a box with a downward and upward arrow equal in size. diagram d shows a box with a downward and upward arrow with the downward arrow larger in size. which force diagram represents the forces on the ball? you may neglect the effects of air resistance.
Answers: 3
Physics, 22.06.2019 18:00
Which statement is true if the refractive index of medium a is greater than that of medium b? a. total internal reflection is possible when light travels from air to medium b to medium a. b. total internal reflection is possible when light travels from medium a to medium b. c. total internal reflection is possible when light travels from medium b to medium a. d. total internal reflection is possible when light travels from air to medium a. e. total internal reflection is possible when light travels from air to medium b.
Answers: 1
You know the right answer?
Questions

Mathematics, 21.05.2021 03:20
Physics, 21.05.2021 03:20
Mathematics, 21.05.2021 03:20

Mathematics, 21.05.2021 03:20
Mathematics, 21.05.2021 03:20
Mathematics, 21.05.2021 03:20

Social Studies, 21.05.2021 03:20
Mathematics, 21.05.2021 03:20
Mathematics, 21.05.2021 03:20
History, 21.05.2021 03:20
Mathematics, 21.05.2021 03:20
Social Studies, 21.05.2021 03:20


