The students observe that the pitches of the sounds from the fire truck and the
ambulance sire...

Physics, 02.03.2020 09:33 fooligan3448
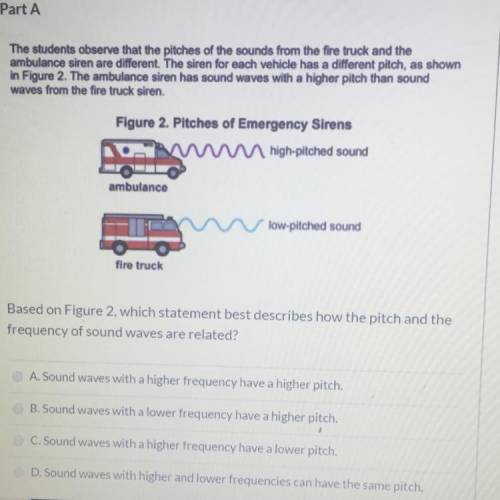
The students observe that the pitches of the sounds from the fire truck and the
ambulance siren are different. The siren for each vehicle has a different pitch, as shown
in Figure 2. The ambulance siren has sound waves with a higher pitch than sound
waves from the fire truck siren
Figure 2. Pitches of Emergency Sirens
10m m high-pitched sound
ambulance
--
m
l
ow. pitched sound
fire truck
Based on Figure 2, which statement best describes how the pitch and the
frequency of sound waves are related?
A. Sound waves with a higher frequency have a higher pitch.
B. Sound waves with a lower frequency have a higher pitch.
C. Sound waves with a higher frequency have a lower pitch.
D. Sound waves with higher and lower frequencies can have the same pitch

Answers: 1


Another question on Physics
Physics, 22.06.2019 18:00
Directions: count the number of atoms. ar co2 na3po4 so3 nac2h3o2
Answers: 1
Physics, 22.06.2019 19:30
Select light for the type of wave, adjust the wavelength so that the light is red, and increase the amplitude of the light to the max. then, select the start button at the source location to begin producing the waves. light is a form of electromagnetic wave, containing oscillating electric and magnetic fields. the wave amplitude detector mentioned above shows how the electric field oscillates in time at the location of the probe. the amplitude of the wave at the location of the probe is equal to the maximum electric field measured. how does the amplitude of the wave depend on the distance from the source?
Answers: 2
Physics, 23.06.2019 02:10
Find the steady-state temperature at the center of the plate = /2, = /2) for sums of w from n=1 to n=19 (only odd values). find the value of n for which the change in /2, /2) is less than 1% from the value at the previous n. at this point, we consider the solution converged. does the value of the temperature at the center seem reasonable? in this part, the values of x and y are constant scalar values. you should produce a plot of the value of n on the horizontal and the estimate of the temperature at the center of the plate on the vertical. b. using the value of n (or larger) that resulted in convergence in part (a), create a contourf plot of the temperature distribution across the entire plate. use enough spatial subdivisions to create a useful plot. comment on the results. hint: you need to determine what “x” and “y” values to use to make your t matrix. i recommend using a different number of x and y values. use enough x and y values so that the plot is “smooth”.
Answers: 1
Physics, 23.06.2019 08:00
Agust of wind pushes a beach ball with a force of 9 newtons. the ball rolls 10 meters in 3 seconds. what is the power of the wind? 900 w 90 w 30 w 3 w
Answers: 2
You know the right answer?
Questions

Mathematics, 02.02.2020 17:48
Mathematics, 02.02.2020 17:48
Mathematics, 02.02.2020 17:48
Mathematics, 02.02.2020 17:48

Biology, 02.02.2020 17:48

Spanish, 02.02.2020 17:48
Physics, 02.02.2020 17:48
SAT, 02.02.2020 17:48

Health, 02.02.2020 17:48

Mathematics, 02.02.2020 17:48
Social Studies, 02.02.2020 17:48
Mathematics, 02.02.2020 17:48

History, 02.02.2020 17:48


