Two software companies are planning to launch a learning application on the same day.
co...

Mathematics, 26.12.2019 07:31 kkatlynn
Two software companies are planning to launch a learning application on the same day.
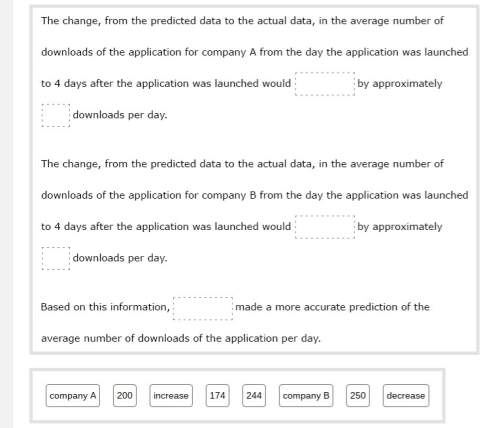
company a predicts that their application will be downloaded 400 times on the first day and that the number of downloads will increase at a rate of 50% per day. this relationship is represented by function f below, where x is the number of days since the launch of the application.
f(x) = 400(1.5)^x
company b predicts that their application will be downloaded 500 times on the first day and that the number of downloads will increase at a rate of 40% per day. this relationship is represented by function g below, where x is the number of days since the launch of the application.
g(x) = 500(1.4)^x
both companies record their number of downloads from the release until 4 days after the release.
company a had 450 downloads on the first day, and the number of downloads increased at a rate of 25% per day. company b had 400 downloads on the first day, and the number of downloads increased at a rate of 60% per day.
use the information above to complete the given statements.

Answers: 1


Another question on Mathematics
Mathematics, 21.06.2019 16:40
How do i get my dad to stop making me gargle his pickle i want my mom to gargle my pickle not my dads
Answers: 3
Mathematics, 21.06.2019 20:50
A. what is the area of the base? use complete sentences to explain your reasoning. b. what is the volume of the prism? use complete sentences to explain your reasoning.
Answers: 1
Mathematics, 21.06.2019 21:30
The map shows the location of the airport and a warehouse in a city. though not displayed on the map, there is also a factory 112 miles due north of the warehouse.a truck traveled from the warehouse to the airport and then to the factory. what is the total number of miles the truck traveled?
Answers: 3
Mathematics, 21.06.2019 22:00
Match the scale and the actual area to the area of the corresponding scale drawing. scale: 1 inch to 4 feet actual area: 128 square feet scale: 1 inch to 7 feet actual area: 147 square feet scale: 1 inch to 8 feet actual area: 256 square feet scale: 1 inch to 5 feet actual area: 225 square feet area of scale drawing scale and actual area scale drawing area: 3 square inches arrowright scale drawing area: 8 square inches arrowright scale drawing area: 4 square inches arrowright scale drawing area: 9 square inches arrowright
Answers: 2
You know the right answer?
Questions

Health, 05.02.2021 21:20


Mathematics, 05.02.2021 21:20

Mathematics, 05.02.2021 21:20
Mathematics, 05.02.2021 21:20


Mathematics, 05.02.2021 21:20

Computers and Technology, 05.02.2021 21:20


