
Mathematics, 01.08.2019 05:00 Ashwaf23474
And show all work 7.04 use mathematical induction to prove the statement is true for all positive integers n, or show why it is false. (4 points each.) 1. 4 ⋅ 6 + 5 ⋅ 7 + 6 ⋅ 8 + + 4n( 4n + 2) = quantity four times quantity four n plus one times quantity eight n plus seven divided all divided by six 2. 12 + 42 + 72 + + (3n - 2)2 = quantity n times quantity six n squared minus three n minus one all divided by two for the given statement pn, write the statements p1, pk, and pk+1. (2 points) 2 + 4 + 6 + . . + 2n = n(n+1)

Answers: 2


Another question on Mathematics
Mathematics, 21.06.2019 14:30
Which of these people has balanced their checkbook correctly? oa. gary: the balance in his check register is $500 and the balance in his bank statement is $500. b. gail: the balance in her check register is $400 and the balance in her bank statement is $500. c. gavin: the balance in his check register is $500 and the balance in his bank statement is $510.
Answers: 2
Mathematics, 21.06.2019 15:00
Which value of c would make he following expression completely factored? 8x+cy
Answers: 1
Mathematics, 21.06.2019 16:00
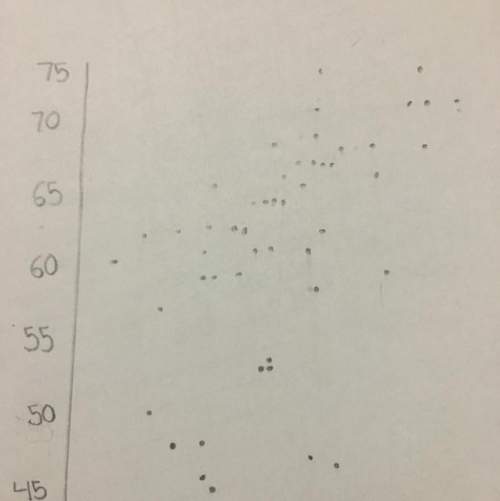
Part one: measurements 1. measure your own height and arm span (from finger-tip to finger-tip) in inches. you will likely need some from a parent, guardian, or sibling to get accurate measurements. record your measurements on the "data record" document. use the "data record" to you complete part two of this project. name relationship to student x height in inches y arm span in inches archie dad 72 72 ginelle mom 65 66 sarah sister 64 65 meleah sister 66 3/4 67 rachel sister 53 1/2 53 emily auntie 66 1/2 66 hannah myself 66 1/2 69 part two: representation of data with plots 1. using graphing software of your choice, create a scatter plot of your data. predict the line of best fit, and sketch it on your graph. part three: the line of best fit include your scatter plot and the answers to the following questions in your word processing document 1. 1. which variable did you plot on the x-axis, and which variable did you plot on the y-axis? explain why you assigned the variables in that way. 2. write the equation of the line of best fit using the slope-intercept formula $y = mx + b$. show all your work, including the points used to determine the slope and how the equation was determined. 3. what does the slope of the line represent within the context of your graph? what does the y-intercept represent? 5. use the line of best fit to you to describe the data correlation.
Answers: 2
Mathematics, 21.06.2019 18:10
The means and mean absolute deviations of the individual times of members on two 4x400-meter relay track teams are shown in the table below. means and mean absolute deviations of individual times of members of 4x400-meter relay track teams team a team b mean 59.32 s 59.1 s mean absolute deviation 1.5 s 245 what percent of team b's mean absolute deviation is the difference in the means? 9% 15% 25% 65%
Answers: 2
You know the right answer?
And show all work 7.04 use mathematical induction to prove the statement is true for all positive in...
Questions
Mathematics, 08.11.2019 07:31
Mathematics, 08.11.2019 07:31

History, 08.11.2019 07:31

English, 08.11.2019 07:31
Mathematics, 08.11.2019 07:31
Mathematics, 08.11.2019 07:31
Mathematics, 08.11.2019 07:31
Mathematics, 08.11.2019 07:31
Mathematics, 08.11.2019 07:31

Physics, 08.11.2019 07:31

English, 08.11.2019 07:31
History, 08.11.2019 07:31


