
Mathematics, 17.09.2019 01:30 kekoanabor19
1. the graph shows the prices of different numbers of bushels of corn at a store in the current year. the table shows the prices of different numbers of bushels of corn at the same store in the previous year.
a graph shows number of bushels on x-axis and price of corn in dollars on y-axis. the x-axis scale is shown from 0 to 14 at increments of 2, and the y-axis scale is shown from 0 to 112 at increments of 16. a straight line joins the ordered pairs 2, 16 and 4, 32 and 6, 48 and 8, 64 and 10, 80 and 12, 96.
previous year
number of bushels
price of corn (dollars)
2
12
4
24
6
36
8
48
part a: describe in words how you can find the rate of change of a bushel of corn in the current year, and find the value. (5 points)
part b: how many dollars more is the price of a bushel of corn in the current year than the price of a bushel of corn in the previous year? show your work. (5 points)
2. gina has borrowed 100 songs from her friend. she plans to download an equal number of songs on her music player each week for 5 weeks. the graph shows the number of songs left to download, y, for a certain number of weeks, x:
a graph titled song downloading shows number of weeks on x-axis and number of songs left to download on y-axis. the x-axis scale is shown from 0 to 5 at increments of 1, and the y-axis scale is shown from 0 to 140 at increments of 20. a straight line joins the ordered pairs 0, 100 and 1, 80 and 2, 60 and 3, 40 and 4, 20 and 5, 0.
part a: what is the rate of change and initial value of the function represented by the graph, and what do they represent in this scenario? show your work to find the rate of change and initial value. (6 points)
part b: write an equation in slope-intercept form to model the relationship between x and y. (4 points)
3. gina has borrowed 100 songs from her friend. she plans to download an equal number of songs on her music player each week for 5 weeks. the graph shows the number of songs left to download, y, for a certain number of weeks, x:
a graph titled song downloading shows number of weeks on x-axis and number of songs left to download on y-axis. the x-axis scale is shown from 0 to 5 at increments of 1, and the y-axis scale is shown from 0 to 140 at increments of 20. a straight line joins the ordered pairs 0, 100 and 1, 80 and 2, 60 and 3, 40 and 4, 20 and 5, 0.
part a: what is the rate of change and initial value of the function represented by the graph, and what do they represent in this scenario? show your work to find the rate of change and initial value. (6 points)
part b: write an equation in slope-intercept form to model the relationship between x and y. (4 points)
3. the graph shows the depth, y, in meters, of a shark from the surface of an ocean for a certain amount of time, x, in minutes:
a graph titled distance vs. time is shown. the x axis is labeled time in minutes and shows numbers 0, 1, 2, 3, 4, 5. the y axis is labeled distance from ocean surface in meters. a straight line joins the points c at ordered pair 0,60, b at ordered pair 1, 100, a at ordered pair 2, 140, and the ordered pair 3, 180.
part a: describe how you can use similar triangles to explain why the slope of the graph between points a and b is the same as the slope of the graph between points a and c. (4 points)
part b: what are the initial value and slope of the graph and what do they represent? (6 points)
4. the distance, y, in centimeters, of an ant from a hole in the tree for a certain amount of time, x, in seconds, is shown in the graph:
a graph titled motion of ant is shown. the graph shows time in seconds on the x-axis and the distance from hole in centimeters on the y-axis. the scale on the x-axis is shown from 0 to 6 at increments of 1, and the scale on the y-axis is shown from 0 to 18 at increments of 3. the graph has 3 straight lines. the first line is labeled k and joins ordered pairs 0, 0 and 2, 9. the second line is labeled l and joins ordered pairs 2, 9 and 5, 9. the third line is labeled m and joins ordered pairs 5, 9 and 7, 0.
part a: is the graph linear or nonlinear? explain your answer. (2 points)
part b: in which segments is the graph increasing, decreasing, and constant? (3 points)
part c: in your own words, describe the motion of the ant, as shown on the graph. (5 points)

Answers: 2
 where m is the slope and b is the y-intercept. In our case, m is just the rate of change we computed and b is the initial value. We just substitute these values to the form:
 and this represents how fast (speed) the shark can dive. We know this because dividing meters over the number of minutes would give us meters/minute and this is describing the speed.
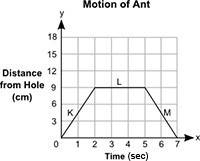


Another question on Mathematics
Mathematics, 21.06.2019 21:10
Jenny earned a 77 on her most recent test jenny score is no less then 5 points greater then 4/5 of terrance’s score if t represents terrance score which inequality represents the situation
Answers: 3
Mathematics, 21.06.2019 22:30
Atotal of 766 tickets were sold for the school play. they were either adult tickets or student tickets. there were 66 more student tickets sold than adult tickets. how many adult tickets were sold?
Answers: 1
Mathematics, 22.06.2019 02:00
An isosceles trapezoid with a perimeter of 42 inches. each of the congruent non parallel sides is 5 inches long, and the trapezoid is 3 inches tall. how long are the two parallel sides? a. 10 in, 22 in b. 16 in, 16 in c. 10 in, 16 in d. 12 in, 20 in
Answers: 1
You know the right answer?
1. the graph shows the prices of different numbers of bushels of corn at a store in the current year...
Questions


Chemistry, 28.11.2019 17:31

Mathematics, 28.11.2019 17:31
Mathematics, 28.11.2019 17:31

Geography, 28.11.2019 17:31


History, 28.11.2019 17:31
Mathematics, 28.11.2019 17:31

Mathematics, 28.11.2019 17:31
English, 28.11.2019 17:31


