
The graph shows the altitude of a bird over time. a graph measuring altitude and time.
what i...

Mathematics, 14.10.2019 06:30 kenoknox
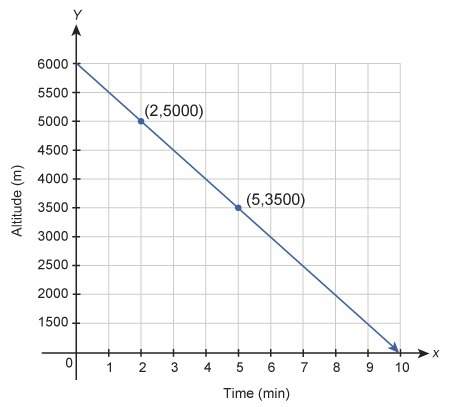
The graph shows the altitude of a bird over time. a graph measuring altitude and time.
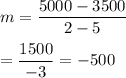
what is the slope of the line and what does it mean in this situation?
the slope is –500 . this means that the bird descends 500 m each minute.
the slope is –350 . this means that the bird descends 350 m each minute.
the slope is 350. this means that the bird ascends 350 m each minute.
the slope is 500. this means that the bird ascends 500 m each minute

Answers: 3


Another question on Mathematics
Mathematics, 21.06.2019 18:00
Four congruent circular holes with a diameter of 2 in. were punches out of a piece of paper. what is the area of the paper that is left ? use 3.14 for pi
Answers: 1
You know the right answer?
Questions

Advanced Placement (AP), 19.11.2019 21:31
Mathematics, 19.11.2019 21:31

Mathematics, 19.11.2019 21:31

Mathematics, 19.11.2019 21:31
Social Studies, 19.11.2019 21:31

Biology, 19.11.2019 21:31
Mathematics, 19.11.2019 21:31
Mathematics, 19.11.2019 21:31
Mathematics, 19.11.2019 21:31


History, 19.11.2019 21:31
Mathematics, 19.11.2019 21:31


