
Mathematics, 21.07.2019 19:10 mszeew
with this. what is the equation of the line shown in this graph? answer your answer in the box. points are: (-2,-3) (3,-3)

Answers: 1
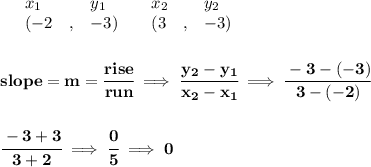
![\bf \stackrel{\textit{point-slope form}}{y-{{ y_1}}={{ m}}(x-{{ x_1}})}\implies y-(-3)=0[x-(-2)] \\\\\\ y+3=0\implies y=-3](/tpl/images/0116/6760/afe0c.png)


Another question on Mathematics
Mathematics, 21.06.2019 15:10
Aboat's value over time is given as the function f(x) and graphed below. use a(x) = 400(b)x + 0 as the parent function. which graph shows the boat's value increasing at a rate of 25% per year?
Answers: 3
Mathematics, 21.06.2019 18:50
Which of the following values cannot be probabilities? 0.08, 5 divided by 3, startroot 2 endroot, negative 0.59, 1, 0, 1.44, 3 divided by 5 select all the values that cannot be probabilities. a. five thirds b. 1.44 c. 1 d. startroot 2 endroot e. three fifths f. 0.08 g. 0 h. negative 0.59
Answers: 2
Mathematics, 21.06.2019 22:50
1. if events a and b are non-overlapping events, how do you find the probability that one or the other occurs? 2. what does it mean if p(a or b) equals 1?
Answers: 2
Mathematics, 22.06.2019 01:50
If its non of them tell me..valerie took a day-trip. she drove from her house for a while and took a coffee break. after her coffee break, she continued driving. after 2 hours of driving after her coffee break, her distance from her house was 210 miles. her average speed during the whole trip was 60 miles per hour.valerie created the equation y−210=60(x−2) to represent this situation, where xx represents the time in hours from her coffee break and yy represents the distance in miles from her house.which graph correctly represents valerie's distance from her house after her coffee break?
Answers: 1
You know the right answer?
with this. what is the equation of the line shown in this graph? answer your answer in the box. po...
Questions

English, 04.07.2019 16:40


Social Studies, 04.07.2019 16:40


Mathematics, 04.07.2019 16:40

Chemistry, 04.07.2019 16:40

Social Studies, 04.07.2019 16:40
History, 04.07.2019 16:40


