
Mathematics, 07.01.2022 07:00 ack12
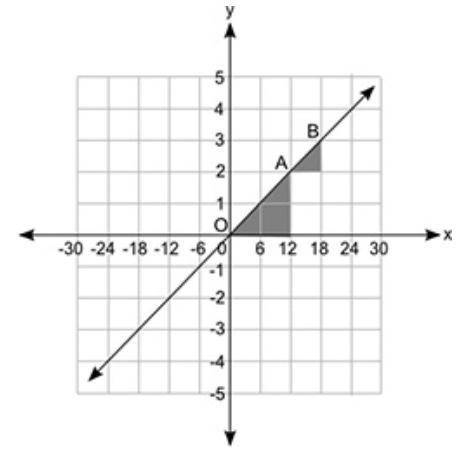
The figure shows a line graph and two shaded triangles that are similar:
A line is shown on a coordinate grid. The x-axis values are from negative 30 to positive 30 in increments of 6 for each grid line. The y-axis values are from negative 5 to positive 5 in increments of 1 for each grid line. The line passes through the ordered pairs negative 24, negative 4, and 0, 0, and 24, 4. A shaded right triangle is formed so that its hypotenuse is from ordered pair 0, 0 labeled as O to 12, 2 labeled as A, one leg is from 0, 0 to 12,0 and the second leg is from 12,0 to 12, 2. Another shaded right triangle is formed with the hypotenuse from 12, 2 and 18, 3 labeled as B, one leg is from 12, 2 to 18, 2 and the second leg is from 18, 2 to 18, 3.
Which statement about the slope of the line is true? (1 point)
Group of answer choices
It is 6 throughout the line.
The slope from point O to point A is fraction 1 over 6 times the slope of the line from point A to point B.
It is fraction 1 over 6 throughout the line.
The slope from point O to point A is six times the slope of the line from point A to point B.

Answers: 1


Another question on Mathematics
Mathematics, 21.06.2019 14:30
The contents of 3838 cans of coke have a mean of x¯¯¯=12.15x¯=12.15. assume the contents of cans of coke have a normal distribution with standard deviation of σ=0.12.σ=0.12. find the value of the test statistic zz for the claim that the population mean is μ=12.μ=12.
Answers: 1
Mathematics, 21.06.2019 19:30
If chord ab is congruent to chord cd, then what must be true about ef and eg?
Answers: 1
Mathematics, 21.06.2019 23:00
Each of the following data sets has a mean of x = 10. (i) 8 9 10 11 12 (ii) 7 9 10 11 13 (iii) 7 8 10 12 13 (a) without doing any computations, order the data sets according to increasing value of standard deviations. (i), (iii), (ii) (ii), (i), (iii) (iii), (i), (ii) (iii), (ii), (i) (i), (ii), (iii) (ii), (iii), (i) (b) why do you expect the difference in standard deviations between data sets (i) and (ii) to be greater than the difference in standard deviations between data sets (ii) and (iii)? hint: consider how much the data in the respective sets differ from the mean. the data change between data sets (i) and (ii) increased the squared difference îł(x - x)2 by more than data sets (ii) and (iii). the data change between data sets (ii) and (iii) increased the squared difference îł(x - x)2 by more than data sets (i) and (ii). the data change between data sets (i) and (ii) decreased the squared difference îł(x - x)2 by more than data sets (ii) and (iii). none of the above
Answers: 2
You know the right answer?
The figure shows a line graph and two shaded triangles that are similar:
A line is shown on a coor...
Questions
Mathematics, 12.01.2021 23:20
Mathematics, 12.01.2021 23:20

Mathematics, 12.01.2021 23:20

Geography, 12.01.2021 23:20

Social Studies, 12.01.2021 23:20

Chemistry, 12.01.2021 23:20

Physics, 12.01.2021 23:20
Mathematics, 12.01.2021 23:20

History, 12.01.2021 23:20


Law, 12.01.2021 23:20
History, 12.01.2021 23:20

English, 12.01.2021 23:30
History, 12.01.2021 23:30


