Please help
The graph of function f is shown.
(Picture added)
Function g is rep...

Mathematics, 20.12.2021 16:00 xlajbd
Please help
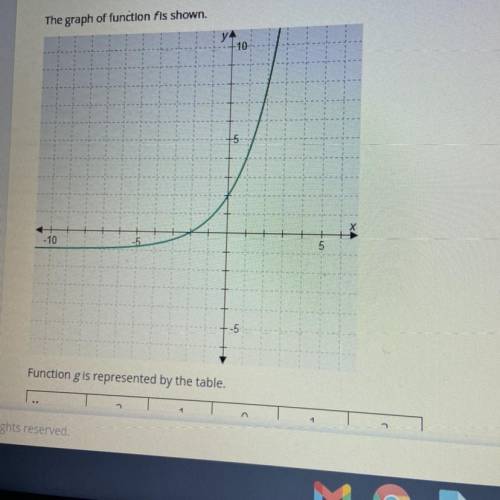
The graph of function f is shown.
(Picture added)
Function g is represented by the table.
X: -2 -1 0 1 2
g(x): -2/3 0 2 8 26
Which statement correctly compares the two functions?
A.) they have the same y-intercept and the same end behavior as x approaches ♾
B.) they have the same x-intercept and the same end behavior as x approaches ♾
C.) they have different x- and y-intercepts but the same end behavior as x approaches ♾
D.) they have the same x- and y-intercepts

Answers: 2


Another question on Mathematics
Mathematics, 21.06.2019 19:00
Human body temperatures have a mean of 98.20° f and a standard deviation of 0.62°. sally's temperature can be described by z = 1.4. what is her temperature? round your answer to the nearest hundredth. 99.07°f 97.33°f 99.60°f 100.45°f
Answers: 1
Mathematics, 21.06.2019 21:50
What is the missing reason in the proof? segment addition congruent segments theorem transitive property of equality subtraction property of equality?
Answers: 3
Mathematics, 21.06.2019 22:10
Which equation is y = -6x2 + 3x + 2 rewritten in vertex form?
Answers: 1
Mathematics, 21.06.2019 23:20
Identify the function that contains the data in the following table: x -2 0 2 3 5 f(x) 5 3 1 2 4 possible answers: f(x) = |x| + 1 f(x) = |x - 2| f(x) = |x - 2| - 1 f(x) = |x - 2| + 1
Answers: 1
You know the right answer?
Questions
Mathematics, 09.10.2019 14:00
Mathematics, 09.10.2019 14:00


Biology, 09.10.2019 14:00
Mathematics, 09.10.2019 14:00
History, 09.10.2019 14:00

Chemistry, 09.10.2019 14:00

Social Studies, 09.10.2019 14:00
English, 09.10.2019 14:00
Mathematics, 09.10.2019 14:00
Mathematics, 09.10.2019 14:00
Mathematics, 09.10.2019 14:00
Mathematics, 09.10.2019 14:00

Computers and Technology, 09.10.2019 14:00


