
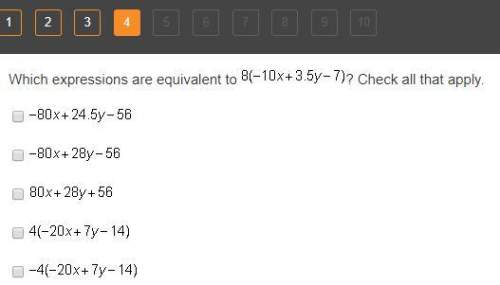
Mathematics, 14.12.2021 01:40 avree9815
Which number line correctly shows 4.5 – 2.5?
a) A number line going from 0 to 4.5 in increments of 0.5. An arrow goes from 0 to 4.5 and then backwards from 4.5 to 2.
b) A number line going from negative 4.5 to 0 in increments of 0.5. An arrow goes from negative 4.5 to negative 2 and then backwards from 0 to negative 4.5.
c) A number line going from negative 2.5 to positive 4.5 in increments of 0.5. An arrow goes from negative 2.5 to 0 and also from 0 to 4.5.
d) A number line going from negative 4.5 to positive 2.5 in increments of 0.5. An arrow goes from 2.5 to 0 and from 0 to negative 4.5.

Answers: 3


Another question on Mathematics
Mathematics, 21.06.2019 17:00
The tuition costs, c, for a local community college are modeled by c(h) = 250 + 200h, where h represents the number of credit hours taken. the local state university has tuition costs, s, modeled by the function s(h) = 300 + 180h. how many credit hours will a student have to take for the two tuition costs to be equal? round the answer to the nearest tenth of an hour.
Answers: 3
Mathematics, 21.06.2019 17:00
Asailor is looking at a kite. if he is looking at the kite at an angle of elevation of 36and the distance from the boat to the point where the kite is directly overhead is 40 feet, how high is the kite?
Answers: 3
Mathematics, 22.06.2019 00:20
If your score on your next statistics test is converted to a z score, which of these z scores would you prefer: minus2.00, minus1.00, 0, 1.00, 2.00? why? a. the z score of 2.00 is most preferable because it is 2.00 standard deviations above the mean and would correspond to the highest of the five different possible test scores. b. the z score of 0 is most preferable because it corresponds to a test score equal to the mean. c. the z score of minus2.00 is most preferable because it is 2.00 standard deviations below the mean and would correspond to the highest of the five different possible test scores. d. the z score of minus1.00 is most preferable because it is 1.00 standard deviation below the mean and would correspond to an above average
Answers: 2
Mathematics, 22.06.2019 01:30
Use the given degree of confidence and sample data to construct a confidence interval for the population mean mu . assume that the population has a normal distribution. a laboratory tested twelve chicken eggs and found that the mean amount of cholesterol was 185 milligrams with sequals 17.6 milligrams. a confidence interval of 173.8 mgless than muless than 196.2 mg is constructed for the true mean cholesterol content of all such eggs. it was assumed that the population has a normal distribution. what confidence level does this interval represent?
Answers: 1
You know the right answer?
Which number line correctly shows 4.5 – 2.5?
a) A number line going from 0 to 4.5 in increments of...
Questions
Mathematics, 17.11.2020 19:20

Business, 17.11.2020 19:20
Mathematics, 17.11.2020 19:20


Arts, 17.11.2020 19:20

Spanish, 17.11.2020 19:20

Social Studies, 17.11.2020 19:20
Business, 17.11.2020 19:20

Mathematics, 17.11.2020 19:20
Mathematics, 17.11.2020 19:20

Biology, 17.11.2020 19:20
Arts, 17.11.2020 19:20
History, 17.11.2020 19:20
History, 17.11.2020 19:20


