Mathematics, 12.12.2021 01:40 malissa0325
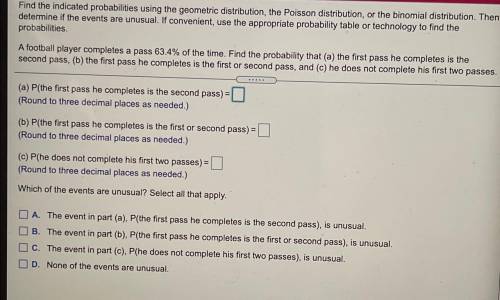
Find the indicated probabilities using the geometric distribution, the Poisson distribution, or the binomial distribution. Then
determine if the events are unusual. If convenient, use the appropriate probability table or technology to find the
probabilities.
A football player completes a pass 63.4% of the time.
Find the probability that (a) the first pass he completes is the
second pass, (b) the first pass he completes is the first or second pass, and (c) he does not complete his first two passes.
(a) P(the first pass he completes is the second pass) =
(Round to three decimal places as needed.)
(b) P(the first pass he completes is the first or second pass) =
(Round to three decimal places as needed.)
(c) P(he does not complete his first two passes)
(Round to three decimal places as needed.)
Which of the events are unusual? Select all that apply.
A. The event in part (a), P(the first pass he completes is the second pass), is unusual.
B. The event in part (b), P(the first pass he completes is the first or second pass), is unusual.
C. The event in part (C), P(he does not complete his first two passes), is unusual.
D. None of the events are unusual.


Answers: 1


Another question on Mathematics

Mathematics, 21.06.2019 14:40
Which system of linear inequalities is represented by the graph? !
Answers: 1


Mathematics, 21.06.2019 19:30
Needmax recorded the heights of 500 male humans. he found that the heights were normally distributed around a mean of 177 centimeters. which statements about max’s data must be true? a) the median of max’s data is 250 b) more than half of the data points max recorded were 177 centimeters. c) a data point chosen at random is as likely to be above the mean as it is to be below the mean. d) every height within three standard deviations of the mean is equally likely to be chosen if a data point is selected at random.
Answers: 2

Mathematics, 21.06.2019 21:30
Name and describe the three most important measures of central tendency. choose the correct answer below. a. the mean, sample size, and mode are the most important measures of central tendency. the mean of a data set is the sum of the observations divided by the middle value in its ordered list. the sample size of a data set is the number of observations. the mode of a data set is its highest value in its ordered list. b. the sample size, median, and mode are the most important measures of central tendency. the sample size of a data set is the difference between the highest value and lowest value in its ordered list. the median of a data set is its most frequently occurring value. the mode of a data set is sum of the observations divided by the number of observations. c. the mean, median, and mode are the most important measures of central tendency. the mean of a data set is the product of the observations divided by the number of observations. the median of a data set is the lowest value in its ordered list. the mode of a data set is its least frequently occurring value. d. the mean, median, and mode are the most important measures of central tendency. the mean of a data set is its arithmetic average. the median of a data set is the middle value in its ordered list. the mode of a data set is its most frequently occurring value.
Answers: 3
You know the right answer?
Find the indicated probabilities using the geometric distribution, the Poisson distribution, or the...
Questions


Mathematics, 14.06.2021 08:10


Physics, 14.06.2021 08:10

English, 14.06.2021 08:10

Biology, 14.06.2021 08:10

Mathematics, 14.06.2021 08:10

Chemistry, 14.06.2021 08:10

English, 14.06.2021 08:10

Spanish, 14.06.2021 08:10


History, 14.06.2021 08:10


Chemistry, 14.06.2021 08:10


