1. Use the table and the graph to answer the questions.
Function 1
х
-1
-2
-3
2
3
у
3
5
7
-3
-5
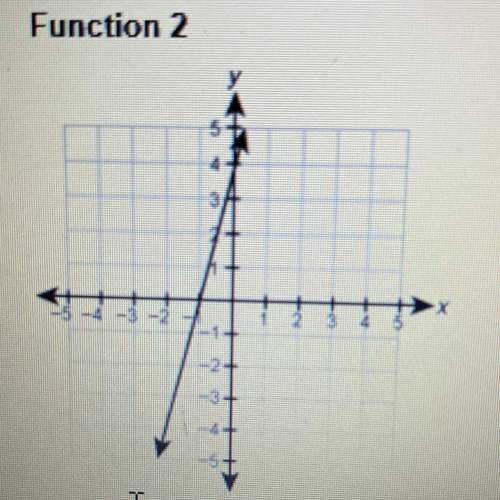
Function 2
(a) What is the rate of change for each function? Show your work.
(b) Which function has the greater rate of change?
The scatterplot below shows the number of hours that students read weekly and the number of hours that they spend on chores weekly. which statement about the scatterplot is true?