
Mathematics, 03.12.2021 05:10 haydenbq
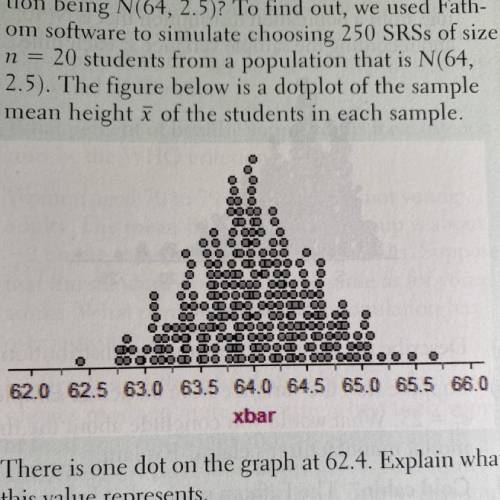
According to the National Center for Health Statistics, the distribution of heights for 16-year-old females is modeled well by a Normal density curve with mean y = 64 inches and standard deviation o = 2.5 inches. To see if this distribution applies at their high school, an AP Statistics class takes an SRS of 20 of the 300 16-year-old females at the school and measures their heights. What values of the sample mean would be consistent with the population distribution being N(64, 2.5)? To find out, we used Fathom software to simulate choosing 250 SRSs of size n=20 students from a population that is N(64,2.5). The figure below is a dotplot of the sample mean height of the students in each sample.

Answers: 3


Another question on Mathematics
Mathematics, 21.06.2019 16:00
On saturday morning, calls arrive at ticketmaster at a rate of 108 calls per hour. what is the probability of fewer than three calls in a randomly chosen minute?
Answers: 1
Mathematics, 21.06.2019 22:30
Kevin's bank offered him a 4.5% interest rate for his mortgage. if he purchases 3 points, what will be his new rate?
Answers: 2
Mathematics, 21.06.2019 23:00
Each of the following data sets has a mean of x = 10. (i) 8 9 10 11 12 (ii) 7 9 10 11 13 (iii) 7 8 10 12 13 (a) without doing any computations, order the data sets according to increasing value of standard deviations. (i), (iii), (ii) (ii), (i), (iii) (iii), (i), (ii) (iii), (ii), (i) (i), (ii), (iii) (ii), (iii), (i) (b) why do you expect the difference in standard deviations between data sets (i) and (ii) to be greater than the difference in standard deviations between data sets (ii) and (iii)? hint: consider how much the data in the respective sets differ from the mean. the data change between data sets (i) and (ii) increased the squared difference îł(x - x)2 by more than data sets (ii) and (iii). the data change between data sets (ii) and (iii) increased the squared difference îł(x - x)2 by more than data sets (i) and (ii). the data change between data sets (i) and (ii) decreased the squared difference îł(x - x)2 by more than data sets (ii) and (iii). none of the above
Answers: 2
Mathematics, 22.06.2019 00:00
Aspacecraft can attain a stable orbit 300 kilometers above earth if it reaches a velocity of 7.7 kilometers per second. the formula for a rocket's maximum velocity v in kilometers per second is vequalsminus0.0098tplusc ln upper r, where t is the firing time in seconds, c is the velocity of the exhaust in kilometers per second, and r is the ratio of the mass of the rocket filled with fuel to the mass of the rocket without fuel. find the velocity of a spacecraft whose booster rocket has a mass ratio of 20, an exhaust velocity of 2.1 km/s, and a firing time of 15 s. can the spacecraft achieve a stable orbit 300 km above earth?
Answers: 3
You know the right answer?
According to the National Center for Health Statistics, the distribution of heights for 16-year-old...
Questions


Social Studies, 17.07.2019 12:00
English, 17.07.2019 12:00

Mathematics, 17.07.2019 12:00
History, 17.07.2019 12:00
History, 17.07.2019 12:00

Computers and Technology, 17.07.2019 12:00
Computers and Technology, 17.07.2019 12:00

Mathematics, 17.07.2019 12:10

English, 17.07.2019 12:10


