
Mathematics, 04.11.2021 14:00 hailey5129
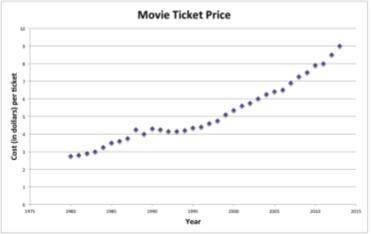
It can be expensive to go to the movie theater. The scatter plot shown here gives the average cost in U. S. dollars of a movie ticket in the U. S. for each year from 1980 to 2013. Using this data, how much do you think a movie ticket will cost in the years 2020 and 2030? Download the worksheet and complete.
1. How has the cost of a movie ticket changed over the last 30 years? What has been the general trend? How can you tell this from the graph?
2. What years did the cost of movie ticket decrease compared to the year before? How can you tell from the graph when the price is decreasing?
3. There was a time where the cost of a movie ticket stayed relatively the same over several years. For what years did the cost stay relatively the same? How can you tell this from the graph?
4. The graph could be divided up into three different periods of relatively consistent ticket price
change: The years 1980 – 1988, 1989 – 1993 and 1994 – 2011. Can you find a typical rate of change in the price of a ticket for each of these time periods? In other words, on average, by how much did the price of a ticket increase by each year during each of these time periods?
5. Predict the cost of a ticket in 2012 – 2015. Plot your predictions and give your actual predictions for each year below. How did you determine how much a ticket would cost each year?
6. What might have been the cost of a ticket during the years 1975 – 1979? Plot your estimates on the grid and give your actual predictions for each year below. How did you determine how much a ticket would cost each year?
7. Find a line of best fit to represent the data. Let y = ticket price and x = the number of years since 1980 (1980 is year zero, 1981 is year one). Approximate a line to represent the data, a slope, a y-intercept and equation that models your line of best fit.
8. Use your equation (or graph or a table) to predict the cost of a movie ticket in the years 2020 and 2030. Be sure to show how you came to each answer.

Answers: 2


Another question on Mathematics
Mathematics, 21.06.2019 19:20
Which number line represents the solution set for the inequality - x 24?
Answers: 3
Mathematics, 21.06.2019 20:30
Martha has a deck of cards. she has lost some of the cards, and now the deck only contains nine spades, eleven diamonds, eight clubs, and twelve hearts. martha predicts that whenever she draws a card from the deck without looking, she will draw a club one-fifth of the time. which activity would best allow martha to test her prediction? a. randomly draw a card from the box and see if it is a club. b. randomly draw a card. then, continue to draw another card until all eight clubs are drawn. c. randomly draw and replace a card 120 times. then, observe how close to 30 times a club is drawn. d. randomly draw and replace a card 100 times. then, observe how close to 20 times a club is drawn.
Answers: 3
Mathematics, 21.06.2019 21:20
Find the missing variable for a parallelogram: a = latex: 28in^2 28 i n 2 h = b = 6.3 in (1in=2.54cm)
Answers: 3
Mathematics, 21.06.2019 22:00
In the sixth grade 13 out of 20 students have a dog if there are 152 sixth grade students how many of them have a dog
Answers: 2
You know the right answer?
It can be expensive to go to the movie theater. The scatter plot shown here gives the average cost i...
Questions
Mathematics, 20.05.2021 20:40

Health, 20.05.2021 20:40


Mathematics, 20.05.2021 20:40


Chemistry, 20.05.2021 20:40
History, 20.05.2021 20:40


Business, 20.05.2021 20:40
History, 20.05.2021 20:40
English, 20.05.2021 20:40
Mathematics, 20.05.2021 20:40
English, 20.05.2021 20:40
Mathematics, 20.05.2021 20:40


