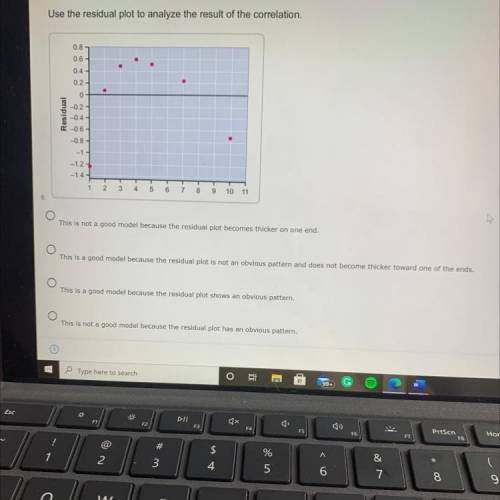
Use the residual plot to analyze the result of the correlation.
0.8
0.6 -
0.4 -
...

Mathematics, 24.10.2021 07:30 foreignev
Use the residual plot to analyze the result of the correlation.
0.8
0.6 -
0.4 -
0.2 -
0
Residual
-0.2
-0.4 -
-0.6
-0.8 -
-1 -
-1.2
-1.4-1
2
3
4
5
6
7
8
9
10 11
This is not a good model because the residual plot becomes thicker on one end.
This is a good model because the residual plot is not an obvious pattern and does not become thicker toward one of the ends.
This is a good model because the residual plot shows an obvious pattern.
This is not a good model because the residual plot has an obvious pattern.

Answers: 2


Another question on Mathematics
Mathematics, 21.06.2019 18:30
Analyze the graph of the cube root function shown on the right to determine the transformations of the parent function. then, determine the values of a, h, and k in the general equation.
Answers: 1
Mathematics, 21.06.2019 19:00
Which values of p and q result in an equation with exactly one solution? px-43=-42x+q choose all answers that apply: a) p=-43 and q=-43 b) p=42 and q=43 c) p=43 and q=−42 d) p=42 and q=42
Answers: 1
Mathematics, 21.06.2019 19:30
Ariel is working at a meat packing plant for 5 nights a week. her regular wage is $11 an hour. she earns tine and a half for any overtime hours. this week she worked 9 hours of over time .how much will ariel earn for overtime this week ?
Answers: 1
Mathematics, 21.06.2019 19:50
Drag each tile into the correct box. not all tiles will be used. find the tables with unit rates greater than the unit rate in the graph. then tenge these tables in order from least to greatest unit rate
Answers: 2
You know the right answer?
Questions

Mathematics, 11.11.2020 22:30
Mathematics, 11.11.2020 22:30


Biology, 11.11.2020 22:30
Biology, 11.11.2020 22:30
English, 11.11.2020 22:30
English, 11.11.2020 22:30
Mathematics, 11.11.2020 22:30
Mathematics, 11.11.2020 22:30
Mathematics, 11.11.2020 22:30
English, 11.11.2020 22:30


