3-10. JOHN'S GIANT REDWOOD,
John found the data in the table below about his
favorite redwoo...

Mathematics, 19.10.2021 19:40 geckos7992
3-10. JOHN'S GIANT REDWOOD,
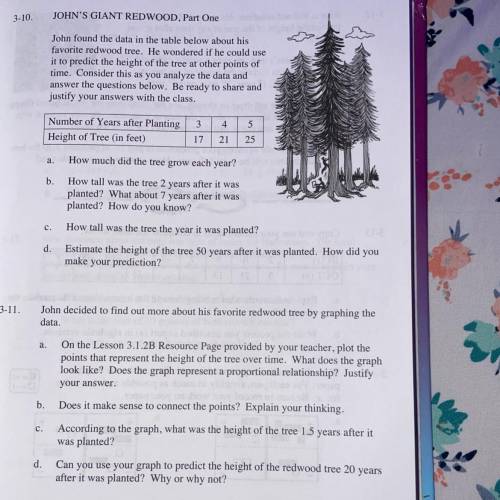
John found the data in the table below about his
favorite redwood tree. He wondered if he could use
it to predict the height of the tree other points of
time. Consider this as you analyze the data and A
answer the questions below. Be ready to share and
justify your answers with the class.
Number of Years after Planting
3 | 4 | 5
Height of Tree (in feet)
17 | 21 | 25
a. How much did the tree grow each year?
b. How tall was the tree 2 years after it was
planted? What about 7 years after it was
planted? How do you know?
c. How tall was the tree the year it was planted?
d. Estimate the height of the tree 50 years after it was planted. How did you
make your prediction?
3-11. John decided to find out more about his favorite redwood tree by graphing the
data.
a. On the Lesson 3.1.2B Resource Page provided by your teacher, plot the
points that represent the height of the tree over time. What does the graph
look like? Does the graph represent a proportional relationship? Justify
your answer.
b. Does it make sense to connect the points? Explain your thinking.
c. According to the graph, what was the height of the tree 1.5 years after it
was planted?
d. Can you use your graph to predict the height of the redwood tree 20 years
after it was planted? Why or why not?
d.

Answers: 2


Another question on Mathematics
Mathematics, 21.06.2019 18:30
At the olympic games, many events have several rounds of competition. one of these events is the men's 100-meter backstroke. the upper dot plot shows the times (in seconds) of the top 8 finishers in the final round of the 2012 olympics. the lower dot plot shows the times of the same 8 swimmers, but in the semifinal round. which pieces of information can be gathered from these dot plots? (remember that lower swim times are faster.) choose all answers that apply: a: the swimmers had faster times on average in the final round. b: the times in the final round vary noticeably more than the times in the semifinal round. c: none of the above.
Answers: 2
Mathematics, 21.06.2019 19:20
The fraction of defective integrated circuits produced in a photolithography process is being studied. a random sample of 300 circuits is tested, revealing 17 defectives. (a) calculate a 95% two-sided confidence interval on the fraction of defective circuits produced by this particular tool. round the answers to 4 decimal places. less-than-or-equal-to p less-than-or-equal-to (b) calculate a 95% upper confidence bound on the fraction of defective circuits. round the answer to 4 decimal places. p less-than-or-equal-to
Answers: 3
Mathematics, 21.06.2019 21:00
Which expression is equivalent to 16 in exponential form? a) 4 × 4 b) 8 × 2 c) 23 d) 24
Answers: 2
You know the right answer?
Questions


Mathematics, 29.11.2020 07:50

English, 29.11.2020 07:50

Mathematics, 29.11.2020 07:50
History, 29.11.2020 07:50
Mathematics, 29.11.2020 07:50
Mathematics, 29.11.2020 07:50

Social Studies, 29.11.2020 07:50
Mathematics, 29.11.2020 07:50
Mathematics, 29.11.2020 07:50
Mathematics, 29.11.2020 07:50
Mathematics, 29.11.2020 07:50
Mathematics, 29.11.2020 07:50
English, 29.11.2020 07:50


