
Mathematics, 01.08.2021 22:00 offensiveneedle
PLEASE HELP
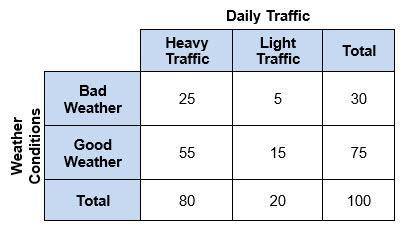
The following two-way table shows the distribution of daily traffic and weather issues in a certain large city.
A 4-column table with 3 rows. Column 1 has entries bad weather, good weather, total. Column 2 is labeled heavy traffic with entries 25, 55, 80. Column 3 is labeled Light traffic with entries 5, 15, 20. Column 4 is labeled Total with entries 30, 75, 100. The columns are titled daily traffic and the rows are titled weather conditions.
Suppose a day from this city is selected at random. Let event A = heavy traffic and event B = bad weather. Are events A and B independent?
No, P(A) = P(B|A).
No, P(A) ≠ P(A|B).
Yes, P(A) = P(A|B).
Yes, P(A) ≠ P(B|A).

Answers: 1


Another question on Mathematics
Mathematics, 21.06.2019 16:00
Find the solution set of this inequality. select the correct graph. |8x+16|> 16
Answers: 1
Mathematics, 21.06.2019 16:30
How do you summarize data in a two-way frequency table?
Answers: 3
You know the right answer?
PLEASE HELP
The following two-way table shows the distribution of daily traffic and weather issues...
Questions

Mathematics, 19.09.2020 01:01

English, 19.09.2020 01:01
Mathematics, 19.09.2020 01:01

Geography, 19.09.2020 01:01


Health, 19.09.2020 01:01

English, 19.09.2020 01:01


