
Mathematics, 19.07.2021 07:10 india73
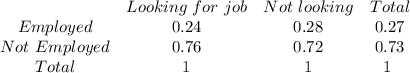
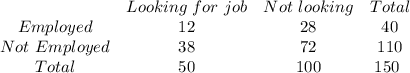
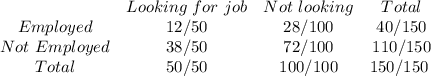
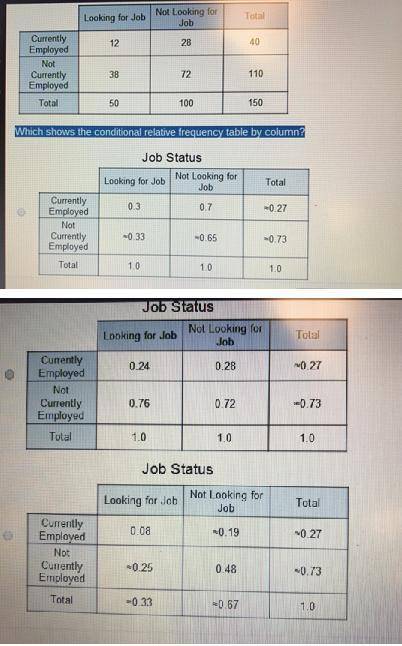
The frequency table represents the job status of a number of high school students. A 4-column table with 3 rows titled job status. The first column has no label with entries currently employed, not currently employed, total. The second column is labeled looking for job with entries 12, 38, 50. The third column is labeled not looking for a job with entries 28, 72, 100. The fourth column is labeled total with entries 40, 110, 150. Which shows the conditional relative frequency table by column? A 4-column table with 3 rows titled job status. The first column has no label with entries currently employed, not currently employed, total. The second column is labeled looking for a job with entries 0.3, nearly equal to 0.33, 1.0. The third column is labeled not looking for job with entries 0.7, nearly equal to 0.65, 1.0. the fourth column is labeled total with entries nearly equal to 0.27, nearly equal to 0.73, 1.0. A 4-column table with 3 rows titled job status. The first column is blank with entries currently employed, not currently employed, total. The second column is labeled Looking for a job with entries 0.12, 0.38, 050. The third column is labeled not looking for a job with entries 0.28, 0.72, 1.00. The fourth column is labeled total with entries 0.4, 1.1, 1.5. A 4-column table with 3 rows titled job status. The first column has no label with entries currently employed, not currently employed, total. The second column is labeled looking for a job with entries 0.24, 0.76, 1.0. The third column is labeled not looking for a job with entries 0.28, 0.72, 1.0. The fourth column is labeled total with entries nearly equal to 0.27, nearly equal to 0.73, 1.0. A 4-column table with 3 rows titled job status. The first column has no label with entries currently employed, not currently employed, total. The second column is labeled looking for job with entries 0.08, nearly equal to 0.25, nearly equal to 0.33. The third column is labeled not looking for a job with entries nearly equal to 0.19, 0.48, nearly equal to 0.67. The f

Answers: 1


Another question on Mathematics
Mathematics, 21.06.2019 14:00
Question 1(multiple choice worth 1 points)(07.06 mc)a group of students must collect at least $150 to organize a science fair. they have already collected $30. which graph best represents all remaining amounts of money, in dollars, that thestudents should still collect to organize the science fair? -210 -180 -150 - 120 -90-60 -300306090 120 150 180 210-210 -180 -150 - 120 -90 -60 -30 0 30 60 90 120 150 180 210-210 -180-150 - 120 -90-60-300 30 60 90 120 150 180 210-210 -180 -150 - 120.90 -60 -30 0 30 60 90 120 150 180 210
Answers: 3
Mathematics, 21.06.2019 20:30
Kayla made observations about the sellin price of a new brand of coffee that sold in the three different sized bags she recorded those observations in the following table 6 is $2.10 8 is $2.80 and 16 is to $5.60 use the relationship to predict the cost of a 20oz bag of coffee.
Answers: 3
Mathematics, 21.06.2019 21:30
Two friends are reading books. jimmy reads a book with 21,356 words. his friend bob reads a book with one-and-a-half times as many words. which expression represents the number of words bob reads?
Answers: 3
Mathematics, 22.06.2019 02:00
Polygon abcd is a parallelogram, and m? abc = 127°. the length of is 10 units, and the length of is 5 units. the perimeter of the parallelogram is units, and m? bcd is °
Answers: 3
You know the right answer?
The frequency table represents the job status of a number of high school students. A 4-column table...
Questions

English, 09.02.2021 19:30

Chemistry, 09.02.2021 19:30
Mathematics, 09.02.2021 19:30

Business, 09.02.2021 19:30

History, 09.02.2021 19:30
History, 09.02.2021 19:30
Mathematics, 09.02.2021 19:30
Mathematics, 09.02.2021 19:30
Mathematics, 09.02.2021 19:30
Business, 09.02.2021 19:30
Mathematics, 09.02.2021 19:30
Mathematics, 09.02.2021 19:30
Mathematics, 09.02.2021 19:30


