
Mathematics, 29.06.2021 19:00 whiteshawn0250
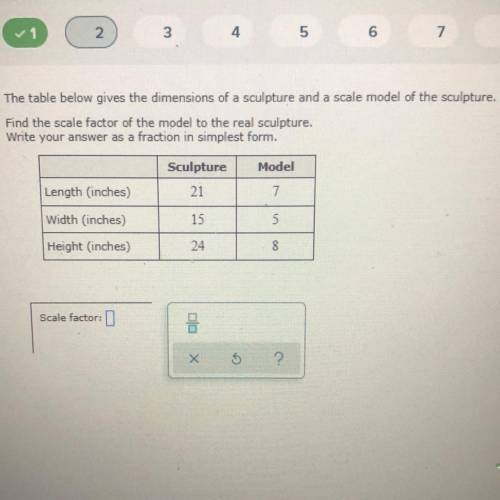
The table below gives the dimensions of a sculpture and a scale model of the sculpture,
Find the scale factor of the model to the real sculpture,
Write your answer as a fraction in simplest form.
Model
Sculpture
21
Length (inches)
7
Width (inches)
15
5
Height (inches)
24
8
Scale factor
음
Х
?

Answers: 3


Another question on Mathematics
Mathematics, 21.06.2019 17:00
In a sample of 2023 u.s. adults, 373 said franklin roosevelt was the best president since world war ii. two u.s. adults are selected at random from the population of all u.s. adults without replacement. assuming the sample is representative of all u.s. adults, complete parts (a) through (d). (a) find the probability that both adults say franklin roosevelt was the best president since world war ii. the probability that both adults say franklin roosevelt was the best president since world war ii is (round to three decimal places as needed.) (b) find the probability that neither adult says franklin roosevelt was the best president since world war ii. the probability that neither adult says franklin roosevelt was the best president since world war ii is (round to three decimal places as needed.) (c) find the probability that at least one of the two adults says franklin roosevelt was the best president since world war ii. the probability that at least one of the two adults says franklin roosevelt was the best president since world war ii is (round to three decimal places as needed.) (d) which of the events can be considered unusual? explain. select all that apply. the event in part left parenthesis a right parenthesis is unusual because its probability is less than or equal to 0.05. the event in part (b) is unusual because its probability is less than or equal to 0.05. none of these events are unusual. the event in part (c) is unusual because its probability is less than or equal to 0.05.
Answers: 3
Mathematics, 21.06.2019 18:30
Create a data set with 8 points in it that has a mean of approximately 10 and a standard deviation of approximately 1.
Answers: 1
Mathematics, 21.06.2019 21:30
Create a graph for the demand for starfish using the following data table: quantity/price of starfish quantity (x axis) of starfish in dozens price (y axis) of starfish per dozen 0 8 2 6 3 5 5 2 7 1 9 0 is the relationship between the price of starfish and the quantity demanded inverse or direct? why? how many dozens of starfish are demanded at a price of five? calculate the slope of the line between the prices of 6 (quantity of 2) and 1 (quantity of 7) per dozen. describe the line when there is a direct relationship between price and quantity.
Answers: 3
Mathematics, 22.06.2019 01:20
Construct a box plot to represent the ages of the actors in a play. step 1: arrange the numbers in order from lowest (on the left) to highest. 24 18 30 26 24 33 32 44 25 28
Answers: 3
You know the right answer?
The table below gives the dimensions of a sculpture and a scale model of the sculpture,
Find the sc...
Questions

Biology, 09.09.2019 21:30

Mathematics, 09.09.2019 21:30


World Languages, 09.09.2019 22:10
History, 09.09.2019 22:10


