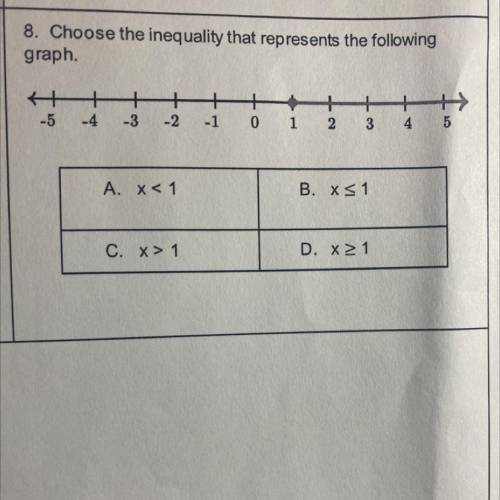
D. x ≥ 1
Step-by-step explanation:
The graph shows a shaded circle which starts at 1. This implies that 1 is included in the possible values of x. The line goes from 1 towards our tight. This means that the possible values of x are greater than or equal to 1.
The inequality representing the graph would be:
x ≥ 1