Mathematics, 27.05.2021 04:30 kayleigh88
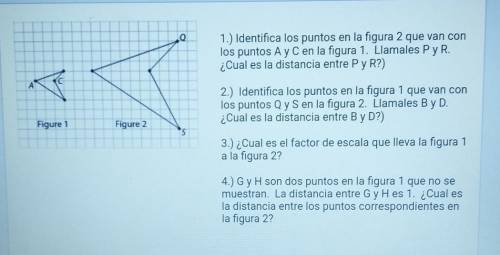
Q 1.) Identifica los puntos en la figura 2 que van con los puntos A y C en la figura 1. Llamales P y R. ¿Cual es la distancia entre P y R?) C С A 2.) Identifica los puntos en la figura 1 que van con los puntos Q y S en la figura 2. Llamales By D. ¿Cual es la distancia entre B y D?) Figure 1 Figure 2 5 3.) ¿Cual es el factor de escala que lleva la figura 1 a la figura 2? 4.) Gy H son dos puntos en la figura 1 que no se muestran. La distancia entre Gy Hes 1. ¿Cual es la distancia entre los puntos correspondientes en la figura 2?


Answers: 1


Another question on Mathematics

Mathematics, 21.06.2019 16:00
Part one: measurements 1. measure your own height and arm span (from finger-tip to finger-tip) in inches. you will likely need some from a parent, guardian, or sibling to get accurate measurements. record your measurements on the "data record" document. use the "data record" to you complete part two of this project. name relationship to student x height in inches y arm span in inches archie dad 72 72 ginelle mom 65 66 sarah sister 64 65 meleah sister 66 3/4 67 rachel sister 53 1/2 53 emily auntie 66 1/2 66 hannah myself 66 1/2 69 part two: representation of data with plots 1. using graphing software of your choice, create a scatter plot of your data. predict the line of best fit, and sketch it on your graph. part three: the line of best fit include your scatter plot and the answers to the following questions in your word processing document 1. 1. which variable did you plot on the x-axis, and which variable did you plot on the y-axis? explain why you assigned the variables in that way. 2. write the equation of the line of best fit using the slope-intercept formula $y = mx + b$. show all your work, including the points used to determine the slope and how the equation was determined. 3. what does the slope of the line represent within the context of your graph? what does the y-intercept represent? 5. use the line of best fit to you to describe the data correlation.
Answers: 2


Mathematics, 22.06.2019 01:00
The equation line of cd is y=-2x-2. write an equation of a line parallels to line cd in slope-intercept form that contains point (4,5)
Answers: 1

Mathematics, 22.06.2019 02:30
According to a research study, parents with young children slept 6.4 hours each night last year, on average. a random sample of 18 parents with young children was surveyed and the mean amount of time per night each parent slept was 6.8. this data has a sample standard deviation of 0.9. (assume that the scores are normally distributed.) researchers conduct a one-mean hypothesis at the 5% significance level, to test if the mean amount of time parents with young children sleep per night is greater than the mean amount of time last year. the null and alternative hypotheses are h0: μ=6.4 and ha: μ> 6.4, which is a right-tailed test. the test statistic is determined to be t0=1.89 using the partial t-table below, determine the critical value(s). if there is only one critical value, leave the second answer box blank.
Answers: 3
You know the right answer?
Q 1.) Identifica los puntos en la figura 2 que van con los puntos A y C en la figura 1. Llamales P y...
Questions


Chemistry, 08.07.2019 06:30

Biology, 08.07.2019 06:30

Mathematics, 08.07.2019 06:30


Mathematics, 08.07.2019 06:30

Health, 08.07.2019 06:30


Health, 08.07.2019 06:30


Biology, 08.07.2019 06:30

Mathematics, 08.07.2019 06:30

Chemistry, 08.07.2019 06:30

Mathematics, 08.07.2019 06:30

History, 08.07.2019 06:30


History, 08.07.2019 06:30

Social Studies, 08.07.2019 06:30


