subject
Mathematics, 26.05.2021 17:30 cjasmine626

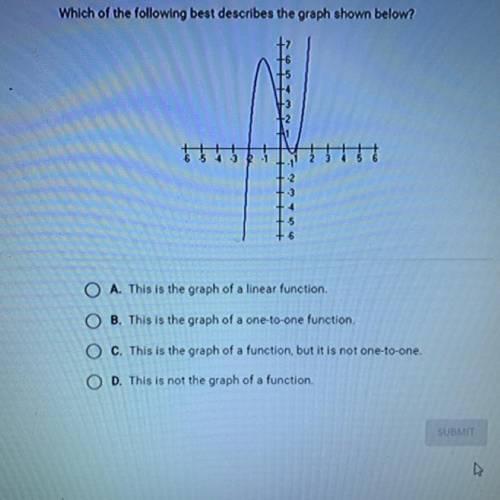
Which of the following best describes the graph shown below? -2
6 5 4 3 2 1
2 3 4 5 6
-2
-3
-5
6
O A. This is the graph of a linear function.
B. This is the graph of a one-to-one function.
C. This is the graph of a function, but it is not one-to-one.
O D. This is not the graph of a function.


Which of the following best describes the graph shown below?

-2
6 5 4 3 2 1
2 3 4 5 6
-2
-3
-5
6

ansver
Answers: 1

Another question on Mathematics

question
Mathematics, 21.06.2019 15:00
What is the missing constant term in the perfect square that starts with x^2 -20x
Answers: 1
question
Mathematics, 21.06.2019 18:40
Juliana says that she can use the patterns of equivalent ratios in the multiplication table below to write an infinite number of ratios that are equivalent to 6: 10. which statement explains whether juliana is correct? she is correct because she can multiply 6 and 10 by any number to form an equivalent ratio. she is correct because 6: 10 can be written as 1: 2 and there are an infinite number of ratios for 1: 2. she is not correct because the multiplication table does not include multiples of 10. she is not correct because 6: 10 is equivalent to 3: 5 and there are only 9 ratios in the multiplication table that are equivalent to 3: 5.
Answers: 1
question
Mathematics, 21.06.2019 21:00
Can some one explain how to slove specifically, what is the value of x? 0.9(x+1.4)-2.3+0.1x=1.6 enter the answer as a decimal in the box. x= ?
Answers: 2
question
Mathematics, 22.06.2019 00:00
Titus works at a hotel. part of his job is to keep the complimentary pitcher of water at least half full and always with ice. when he starts his shift, the water level shows 4 gallons, or 128 cups of water. as the shift progresses, he records the level of the water every 10 minutes. after 2 hours, he uses a regression calculator to compute an equation for the decrease in water. his equation is w –0.414t + 129.549, where t is the number of minutes and w is the level of water. according to the equation, after about how many minutes would the water level be less than or equal to 64 cups?
Answers: 2
You know the right answer?
Which of the following best describes the graph shown below? -2
6 5 4 3 2 1
2 3 4 5 6
Questions
question
Physics, 19.05.2020 17:03
question
Mathematics, 19.05.2020 17:03
Questions on the website: 13722363