
Mathematics, 13.05.2021 23:10 karenpazyuli
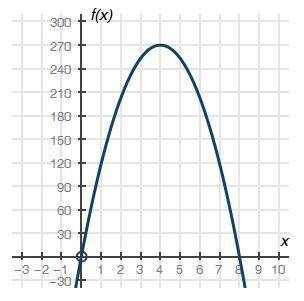
The graph below shows a company's profit f(x), in dollars, depending on the price of erasers x, in dollars, sold by the company:
Graph of quadratic function f of x having x intercepts at ordered pairs 0, 0 and 8, 0. The vertex is at 4, 270.
Part A: What do the x-intercepts and maximum value of the graph represent? What are the intervals where the function is increasing and decreasing, and what do they represent about the sale and profit? (4 points)
Part B: What is an approximate average rate of change of the graph from x = 1 to x = 4, and what does this rate represent? (3 points)
Part C: Describe the constraints of the domain. (3 points)

Answers: 2


Another question on Mathematics
Mathematics, 21.06.2019 17:30
Which of the following equations is of the parabola whose vertex is at (2, 3), axis of symmetry parallel to the y-axis and p = 4? a.)y-3 = 1/16 (x-2)^2 b.)y+3 = -1/16 (x+2)^2 c.)x-2 = 1/16 (y-3)^2
Answers: 3
Mathematics, 21.06.2019 18:10
The means and mean absolute deviations of the individual times of members on two 4x400-meter relay track teams are shown in the table below. means and mean absolute deviations of individual times of members of 4x400-meter relay track teams team a team b mean 59.32 s 59.1 s mean absolute deviation 1.5 s 245 what percent of team b's mean absolute deviation is the difference in the means? 9% 15% 25% 65%
Answers: 2
Mathematics, 21.06.2019 23:30
Jane has 5 nickels.john has 3 dimes.jane says she has a greater amount of money.with the information given,is she correct?
Answers: 3
You know the right answer?
The graph below shows a company's profit f(x), in dollars, depending on the price of erasers x, in d...
Questions

Mathematics, 09.10.2019 23:00
Mathematics, 09.10.2019 23:00
History, 09.10.2019 23:00

Mathematics, 09.10.2019 23:00


Chemistry, 09.10.2019 23:00


Physics, 09.10.2019 23:00
Mathematics, 09.10.2019 23:00


