
Mathematics, 03.05.2021 19:50 bridgetosanders
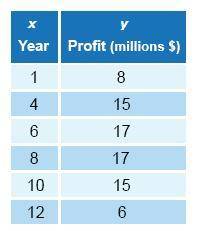
This table shows the profit for a company (in millions of dollars) in different years.
The quadratic regression equation that models these data is y = -0.34x^2 + 4.43x +3.46. Using the quadratic regression equation, what was the predicted profit in year 4?
The answer is $15.74 million
: )

Answers: 1


Another question on Mathematics
Mathematics, 21.06.2019 20:30
If a 36 inch yardstick casts a 21 foot shadow, how tall is a building whose shadow is 168 feet? what is the scale factor
Answers: 1
Mathematics, 21.06.2019 22:20
Select the correct answer from each drop-down menu. the table shows the annual sales revenue for different types of automobiles from three automobile manufacturers. sales revenue (millions of dollars) suv sedan truck marginal total b & b motors 22 15 9 46 pluto cars 25 27 10 62 panther motors 26 34 12 72 marginal total 73 76 31 180 the company with the highest percentage of sales revenue from sedans is . of the annual sales revenue from suvs, the relative frequency of pluto cars is .
Answers: 1
Mathematics, 21.06.2019 23:00
Graph the system of equations. {6x−4y=−244x−8y=−32 use the line tool to graph the lines.
Answers: 1
Mathematics, 21.06.2019 23:10
What is the distance between the points (2, 5) and (5,9)?
Answers: 1
You know the right answer?
This table shows the profit for a company (in millions of dollars) in different years.
The quadrat...
Questions

English, 03.05.2020 13:31
Mathematics, 03.05.2020 13:31
Mathematics, 03.05.2020 13:31
Mathematics, 03.05.2020 13:31

Business, 03.05.2020 13:31

Mathematics, 03.05.2020 13:31
History, 03.05.2020 13:31

Mathematics, 03.05.2020 13:31


