
Mathematics, 30.04.2021 06:00 gvizabal
PLEEAS HELP I already solved half of it pls help on part 4 and down.
YOUR ASSIGNMENT: Desert Temperatures
In this assignment, you may work alone, with a partner, or in a small group. Discuss the results of your work and/or any lingering questions with your teacher.
Temperature in the desert can be modeled by the function C(t), where t represents hours after midnight (0 ≤ t ≤ 24), and C is the temperature measured in degrees Celsius. Examine what happens to the graph when you transform the function to degrees Fahrenheit.
Circle the desert you picked:
Sahara Desert
Patagonian Desert
Death Valley California(I choose this one)
Exploring Degrees Celsius
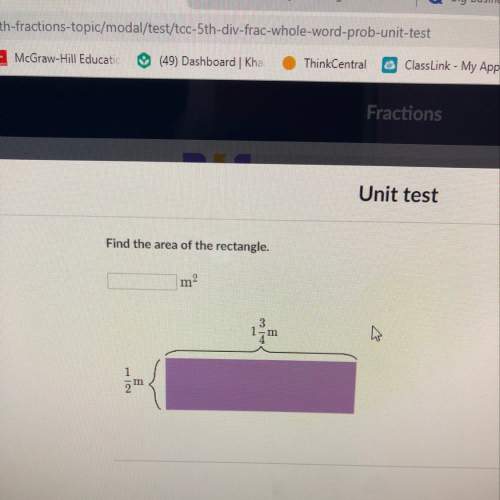
1. Fill out the following chart to find the temperatures for t = 12 (noon) and t = 24 (midnight). (2 points: 1 point for each row)
t
C(t) = –0.30(t – 12)2 + 40
0
12
C(t) = -0.30 (12 - 12)² + 40
C(t) = -0.30 (0)² + 40
C(t) = 40
24
C(t) = -0.30 (24 - 12)² + 40
C(t) = -0.30 (12)² + 40
C(t) = -0.30 × 144 + 40
C(t) = - 43.2 + 40
C(t) = -3.2
2. Plot the three points from the chart onto the graph below. Use the plotted points to sketch the graph of C(t) = –0.30(t – 12)2 + 40. (3 points: 2 points for correct coordinates, 1 point for correct shape)
Convert the Function to Degrees Fahrenheit:
3. Suppose you want to represent the desert temperature in degrees Fahrenheit instead. How would you transform the function C(t) to make the new function, F(t)? (2 points: 1 point for each transformation)
Note: The conversion rule for Celsius to Fahrenheit is .
F(t)=9/5{–0.30 (t – 12)² + 40}+32
F(t) = -0.54 (t – 12)² + 72 + 32
F(t) = -0.54 (t – 12)² + 104
4. Take your values from the previous chart (in question 2) and convert them from Celsius to Fahrenheit. Follow the example below, and use the conversion rule to fill out the chart for degrees Fahrenheit when t = 12 and t = 24. (2 points: 1 point for each row)
t
0
12
24
5. Use the conversion formula to write the equation for the new function, F(t).
(4 points: 2 points for setting up the equation, 2 points for the answer)
Hint: Substitute the equation for C(t) into .
6. Plot the points from the Fahrenheit chart in question 4 onto the graph below. Use the plotted points to sketch out the graph of F(t). (3 points: 2 points for correct coordinates, 1 point for correct shape)
7. Compare the graph in question 6 (F(t)) with the graph in question 2 (C(t)). What changes were made to the graph of C(t) to transform it to F(t)? (1 point)

Answers: 3


Another question on Mathematics
Mathematics, 21.06.2019 23:00
The value of cos 30° is the same as which of the following?
Answers: 1
Mathematics, 22.06.2019 01:00
Lines f and g are cut by the transversal d. the measure of 1 = 2x + 35 and the measure of 8 = 10x - 85. what value of x will show that lines f and g are parallel? a. 19 b. 26 c. 18 d. 15
Answers: 1
Mathematics, 22.06.2019 01:30
Talia took the bus from her home to the bank and then walked back to her home along the same route. the bus traveled at an average speed of 40 km/h and she walked at an average speed of 5 km/h. to determine the time, x, that it took talia to walk home, she used the equation 40(0.9 – x) = 5x. the time of trip 2 is hours. the distance of trip 1 is km.
Answers: 1
Mathematics, 22.06.2019 01:30
What is 0.368,0.380,0.365,and 0.383 in order from least to greatest
Answers: 1
You know the right answer?
PLEEAS HELP I already solved half of it pls help on part 4 and down.
YOUR ASSIGNMENT: Desert Tempe...
Questions
Mathematics, 25.02.2021 05:50


History, 25.02.2021 05:50


Mathematics, 25.02.2021 05:50
History, 25.02.2021 05:50
History, 25.02.2021 05:50
History, 25.02.2021 05:50
Mathematics, 25.02.2021 05:50

Chemistry, 25.02.2021 05:50
Physics, 25.02.2021 05:50
Mathematics, 25.02.2021 05:50


