
Mathematics, 24.04.2021 19:10 lurinha8
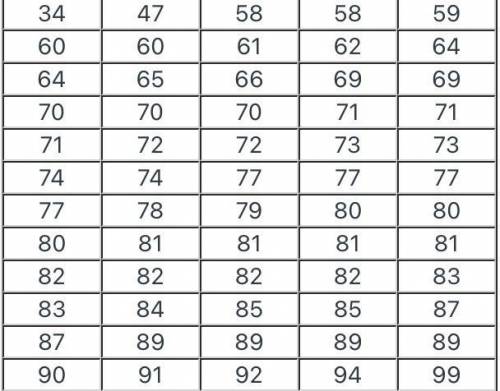
60 students were given a history exam. Their scores were normally distributed with a mean of 75.5 and standard deviation of 11.9. The original scores are shown in the table.
A.) If a student earns a score of 88, what is the z-score for this raw score?
B.) What is the percent of the scores above and below 88? Write as a percent rounded to 1 decimal place.
C.) What percent of the exam scores are between 70 and 90?
D.) What score would a student have earned if there z-score was 1.4?
E.) What score would a student have to earn to be in the 80th percentile?
F.) Now Consider both John and Mary both took tests on the same day. John took a history test in the class above and Mary took a math test. John scored an 85 on the history test in the class above and his sister Mary took a math test and scored 81.
Now if it was known that the distribution of the math grades was also normally distributed with a mean of 76 and standard deviation of 2, who scored better in comparison to their class? It appears John’s has a higher overall raw score, but who did better with respect to their class? How do you know?

Answers: 2


Another question on Mathematics
Mathematics, 21.06.2019 16:00
Aswim teacher sells lesson packages. the best deal has the highest ratio of lessons to total cost.swim lesson packagesnumber of lessons total cost$10$4010 1 $8015$80which package is the best deal? l lesson for $105 lessons for $4010 lessons for $8015 lessons for $80mark this and returnsave and exit
Answers: 3
Mathematics, 21.06.2019 22:30
Ron has 8 caps and 4 of his caps are blue. thes rest of his cap are red. how many of ron's caps are red
Answers: 1
Mathematics, 21.06.2019 23:00
Someone answer this asap for the function f(x) and g(x) are both quadratic functions. f(x) = x² + 2x + 5 g(x) = x² + 2x - 1 which statement best describes the graph of g(x) compared to the graph of f(x)? a. the graph of g(x) is the graph of f(x) shifted down 1 units. b. the graph of g(x) is the graph of f(x) shifted down 6 units. c. the graph of g(x) is the graph of f(x) shifted to the right 1 unit. d. the graph of g(x) is the graph of f(x) shifted tothe right 6 units.
Answers: 3
Mathematics, 21.06.2019 23:30
Apyramid fits exactly inside a cube. the cube and the pyramid share the same square base, and they are both exactly the same height. the volume of the cube is 66 cubic inches. what is the volume of the pyramid? explain your answer. answer asap
Answers: 1
You know the right answer?
60 students were given a history exam. Their scores were normally distributed with a mean of 75.5 an...
Questions

Mathematics, 16.12.2019 08:31
Mathematics, 16.12.2019 08:31

Physics, 16.12.2019 08:31

Mathematics, 16.12.2019 08:31
English, 16.12.2019 08:31
Mathematics, 16.12.2019 08:31
Mathematics, 16.12.2019 08:31
Mathematics, 16.12.2019 08:31
History, 16.12.2019 08:31

Business, 16.12.2019 08:31

English, 16.12.2019 08:31


