
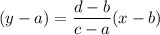
Which equation does the graph below represent?
a coordinate grid is shown. the x-axis v...

Mathematics, 07.10.2019 13:30 alizeleach0123
Which equation does the graph below represent?
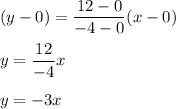
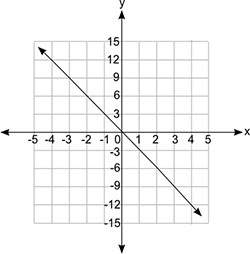
a coordinate grid is shown. the x-axis values are from negative 5 to positive 5 in increments of 1 for each grid line, and the y-axis values are from negative 15 to positive 15 in increments of 3 for each grid line. a line is shown passing through the ordered pairs negative 4, 12 and 0, 0 and 4, negative 12.
y = fraction negative 1 over 3x
y = −3x
y = 3x
y = fraction 1 over 3x

Answers: 2


Another question on Mathematics
Mathematics, 21.06.2019 12:30
Option 1: $30 an hour plus a nonrefundable deposit of $50 option 2: $20 an hour plus a nonrefundable deposit of $75 kyle is renting a jetski for the day. if he can rent the jetski in one hour increments, what is the minimum number of hours must he rent the jetski for option 2 to be a better deal then option 1?
Answers: 1
Mathematics, 21.06.2019 18:10
The number of branches on a tree demonstrates the fibonacci sequence. how many branches would there be on the next two levels of this tree? 13 | | | m branches
Answers: 3
Mathematics, 21.06.2019 20:30
Solve each quadratic equation by factoring and using the zero product property. n^2 - 49 = 0
Answers: 2
You know the right answer?
Questions

Geography, 20.05.2021 01:00


Biology, 20.05.2021 01:00

Business, 20.05.2021 01:00
Mathematics, 20.05.2021 01:00

Biology, 20.05.2021 01:00
Mathematics, 20.05.2021 01:00
Mathematics, 20.05.2021 01:00


