So we assume that the inequaity represents the shaded reigon
you have to know the meaning of the line
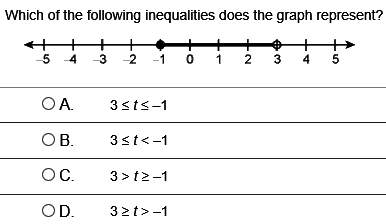
the line goes from -1 to 3 so t is more than -1 and less than 3 so -1>t>3,
but there are special points
the point where the line stops at -1 is shaded in meaning that values above -1 and including -1 are in the solution -1<t
the other point at 3, is not shaded in, meaning that points below 3 and not including 3 are included so t<3
the solution is -1<t<3 or 3>t>-1 or C