For questions 1-3, identify the situation that each graph could represent.
1.
a. the le...

Mathematics, 25.12.2019 16:31 iloveporche6364
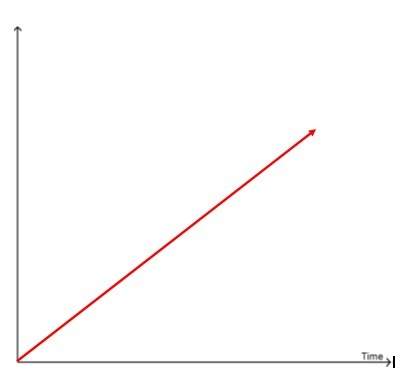
For questions 1-3, identify the situation that each graph could represent.
1.
a. the length of a necklace that you make at a rate of 10 cm per hour without taking a break.
b. the height of a balloon as it rises, get caught in a tree for a few minutes and then continues to rise.
c. the total distance you are from home if you ride your bicycle three miles per hour for one hour, and then stop and take a rest.
d. the volume of water in a bath tub as it is draining.
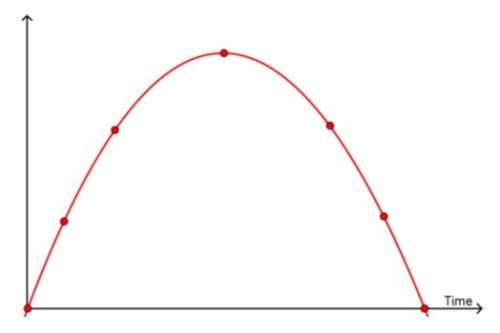
2.
a. the height of a bean sprout planted outside that grows 0.5 cm per hour during the day and 0 cm per hour at night.
b. the height a baseball is thrown into the air
c. the distance you are from home if you drive at a speed of 35 miles per hour.
d. the amount of money a student earns at an afterschool job.
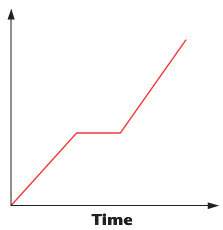
3.
a. the distance you are from home if you walk to your friend's house, stay there for 5 minutes and then walk to school.
b. the volume of water in a pool that is being drained at a rate of 50 gallons per minute
c. the height of a ball bounced on a ground.
d. the amount of charge left in a cell phone if it is fully charged, then used for a while, turned off for a while and then used some more.
graphs are in order as placed

Answers: 3


Another question on Mathematics
Mathematics, 21.06.2019 14:30
Find all the values of x that make 0.1x + 0.25(102 - x) < 17.10 true.
Answers: 1
Mathematics, 21.06.2019 17:00
Complete the equation of the line through (−10,3) and (−8,−8). use exact numbers.
Answers: 1
Mathematics, 21.06.2019 20:00
Choose the linear inequality that describes the graph. the gray area represents the shaded region. a: y ≤ –4x – 2 b: y > –4x – 2 c: y ≥ –4x – 2 d: y < 4x – 2
Answers: 2
You know the right answer?
Questions
Mathematics, 03.02.2021 16:40
Mathematics, 03.02.2021 16:40

Mathematics, 03.02.2021 16:40
Mathematics, 03.02.2021 16:40
Mathematics, 03.02.2021 16:40
Social Studies, 03.02.2021 16:40
Mathematics, 03.02.2021 16:40
Mathematics, 03.02.2021 16:40
Mathematics, 03.02.2021 16:40


English, 03.02.2021 16:40
Mathematics, 03.02.2021 16:50


