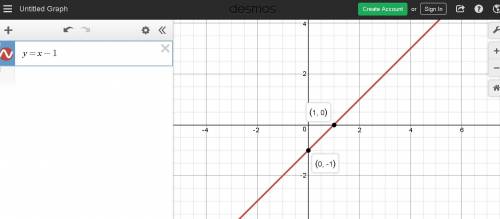
The graph in the attached figure
Step-by-step explanation:
we have

This is a linear equation
Isolate the variable y

we know that
The slope of the line is positive 
The x-intercept is the point  ----> value of x when the value of y is equal to zero
The y-intercept is the point  ----> value of y when the value of x is equal to zero
Plot the intercepts to graph the line
see the attached figure