step-by-step explanation:
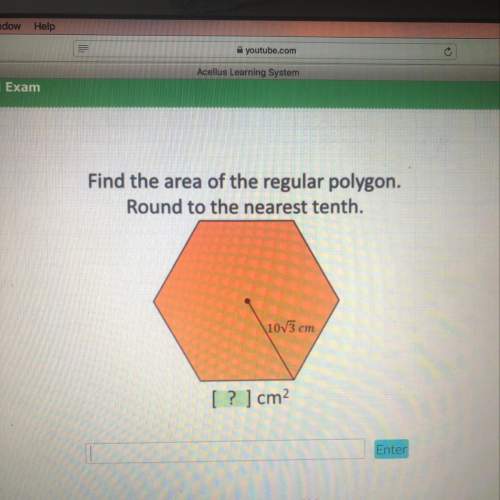
there is a formula i can give you:
it is r^2*n*sin(360/n) divided by 2 where r represents the "radius" and n is the number of sides.
plug them in:
(10sqrt(3))^2*6*sin(360/6) divided by 2
100*3*6*sin(60) divided by 2
900*sin(60)
900*sqrt(3)/2
450*sqrt(3)
approx is 779.4 cm^2