

Need with these 5 !
#1 the graph shows a journey in a car. which of the statements mos...

Mathematics, 02.11.2019 21:31 jalisabarnes12401
Need with these 5 !
#1 the graph shows a journey in a car. which of the statements most likely describes the journey at the portion of the graph labeled k?
a line graph is drawn on the first quadrant of a coordinate plane. the x axis is labeled time in seconds, and the y axis is labeled distance in miles. the line graph is divided into 7 segments labeled i, j, k, l, m, n, and o. i starts at the origin and is a straight line slanting up. j is a line segment that starts at the end of i and is horizontal. k is a curve that starts at the end of j and curves up. l is a straight line that starts at the end of k and is horizontal. m is a straight line that starts at the end of l and slopes down. n is a straight line that starts at the end of m and is horizontal. o is a curve that starts at the end of n and curves down to finally touch the x axis.
the car travels the same distance per unit of time because the portion shows a linear, increasing function.
the car travels different distances per unit of time because the portion shows a linear, increasing function.
the car travels different distances per unit of time because the portion shows a nonlinear, increasing function.
the car travels the same distance per unit of time because the portion shows a nonlinear, increasing function.
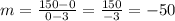
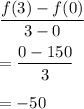
#2 he graph below plots a function f(x):
graph of line segment going through ordered pairs 0,150 and 3, 0
if x represents time, the average rate of change of the function f(x) in the first three seconds is
#3 the tables below show the values of y corresponding to different values of x:
table a
x 3 3 2
y 1 0 0
table b
x 3 5 5
y −2 2 −2
which statement is true for the tables?
both table a and table b represent functions.
both table a and table b do not represent functions.
table a does not represent a function, but table b represents a function.
table a represents a function, but table b does not represent a function.
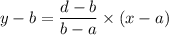
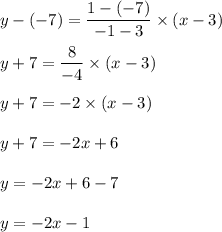
#4 what is the slope of the line that passes through (3, −7) and (−1, 1)?
undefined
0
−2
2
#5 state the domain of the relation.
discrete graph defined on the set of points negative two comma negative four and zero comma zero and positive one comma positive one and positive two comma positive two and positive three comma positive one and positive four comma positive six.
{−2, 0, 1, 2, 3, 4}
{−4, 0, 1, 2, 6}
{0, 1, 2, 3}
{−2, 4}

Answers: 3


Another question on Mathematics
Mathematics, 21.06.2019 15:30
Look at the following graph of the given equation. determine whether the equation is a function. explain why or why not.
Answers: 1
Mathematics, 21.06.2019 17:00
Idont understand math at all! : o( use this scenario to answer the remaining questions: brenton purchased a new bedroom set for $4,500.00. he lives in arizona and pays a 8.75% sales tax. if he made a 50% down payment and financed the rest, what amount did he finance? what is the total sales tax brenton will pay? enter your answer in currency format, round to the nearest cent. what was brenton's total amount financed? enter your answer in currency format, round to the nearest cent.
Answers: 3
Mathematics, 22.06.2019 01:30
Becca wants to mix fruit juice and soda to make a punch. she can buy fruit juice for $3 a gallon and soda for $4 a gallon. if she wants to make 28 gallons of punch at a cost of $3.25 a gallon, how many gallons of fruit juice and how many gallons of soda should she buy?
Answers: 2
You know the right answer?
Questions

Biology, 19.07.2019 07:10


Biology, 19.07.2019 07:10
Biology, 19.07.2019 07:10
Mathematics, 19.07.2019 07:10

Mathematics, 19.07.2019 07:10
Mathematics, 19.07.2019 07:10
Physics, 19.07.2019 07:10

Business, 19.07.2019 07:10

Mathematics, 19.07.2019 07:10
Mathematics, 19.07.2019 07:10

Social Studies, 19.07.2019 07:10
Mathematics, 19.07.2019 07:10
Mathematics, 19.07.2019 07:10


