
Mathematics, 07.04.2021 16:00 yungking1329
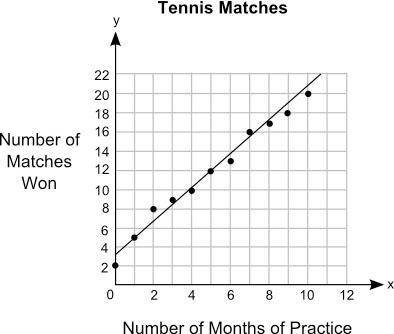
The graph shows the relationship between the number of months different students practiced tennis and the number of matches they won:
The title of the graph is Tennis Matches. On x axis, the label is Number of Months of Practice. On y axis, the label is Number of Matches Won. The scale on the y axis is from 0 to 22 at increments of 2, and the scale on the x axis is from 0 to 12 at increments of 2. The points plotted on the graph are the ordered pairs 0, 2 and 1, 5 and 2, 8 and 3, 9 and 4, 10 and 5, 12 and 6, 13 and 7, 16 and 8,17 and 9, 18 and 10,20. A straight line is drawn joining the ordered pairs 0, 3.3 and 2, 6.8 and 4, 10 and 6, 13.5 and 8, 17 and 10, 20.5.
Part A: What is the approximate y-intercept of the line of best fit and what does it represent? (5 points)
Part B: Write the equation for the line of best fit in the slope-intercept form and use it to predict the number of matches that could be won after 13 months of practice Show your work and include the points used to calculate the slope. (5 points)

Answers: 3


Another question on Mathematics
Mathematics, 20.06.2019 18:04
Alarge rectangle is divided into four smaller rectangles.
Answers: 1
You know the right answer?
The graph shows the relationship between the number of months different students practiced tennis an...
Questions


Mathematics, 24.02.2020 21:36
English, 24.02.2020 21:37


