Mathematics, 01.04.2021 22:00 kataldaine
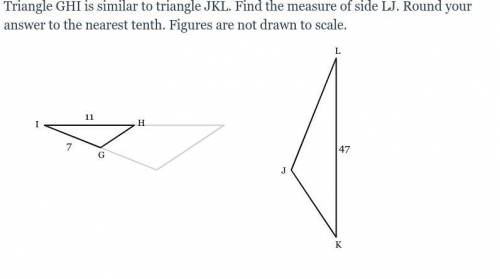
Triangle GHI is similar to triangle JKL. Find the measure of side LJ. Round your answer to the nearest tenth. Figures are not drawn to scale.


Answers: 2


Another question on Mathematics

Mathematics, 21.06.2019 15:00
Listed in the table is the percentage of students who chose each kind of juice at lunchtime. use the table to determine the measure of the central angle you would draw to represent orange juice in a circle graph
Answers: 1

Mathematics, 21.06.2019 21:30
Name and describe the three most important measures of central tendency. choose the correct answer below. a. the mean, sample size, and mode are the most important measures of central tendency. the mean of a data set is the sum of the observations divided by the middle value in its ordered list. the sample size of a data set is the number of observations. the mode of a data set is its highest value in its ordered list. b. the sample size, median, and mode are the most important measures of central tendency. the sample size of a data set is the difference between the highest value and lowest value in its ordered list. the median of a data set is its most frequently occurring value. the mode of a data set is sum of the observations divided by the number of observations. c. the mean, median, and mode are the most important measures of central tendency. the mean of a data set is the product of the observations divided by the number of observations. the median of a data set is the lowest value in its ordered list. the mode of a data set is its least frequently occurring value. d. the mean, median, and mode are the most important measures of central tendency. the mean of a data set is its arithmetic average. the median of a data set is the middle value in its ordered list. the mode of a data set is its most frequently occurring value.
Answers: 3

Mathematics, 22.06.2019 03:10
Two groups of students were asked how many hours they spent reading each day. the table below shows the numbers for each group: group a 1 2 1 1 3 3 2 2 3 group b 3 2 3 2 2 2 1 1 2 based on the table, which of the following is true? the interquartile range for group a students is 0.5 less than the interquartile range for group b students. the interquartile range for group a students is equal to the interquartile range for group b students. the interquartile range for group a employees is 0.5 more than to the interquartile range for group b students. the interquartile range for group a employees is 1 more than the interquartile range for group b students.
Answers: 1

Mathematics, 22.06.2019 04:30
Where would an imaginary line need to be drawn to reflect across an axis of symmetry so that a regular pentagon can carry onto itself
Answers: 1
You know the right answer?
Triangle GHI is similar to triangle JKL. Find the measure of side LJ. Round your answer to the neare...
Questions


History, 25.11.2019 21:31


Mathematics, 25.11.2019 21:31


Mathematics, 25.11.2019 21:31


History, 25.11.2019 21:31


Arts, 25.11.2019 21:31


Mathematics, 25.11.2019 21:31

Mathematics, 25.11.2019 21:31


