
Mathematics, 26.03.2021 22:50 aa1000220
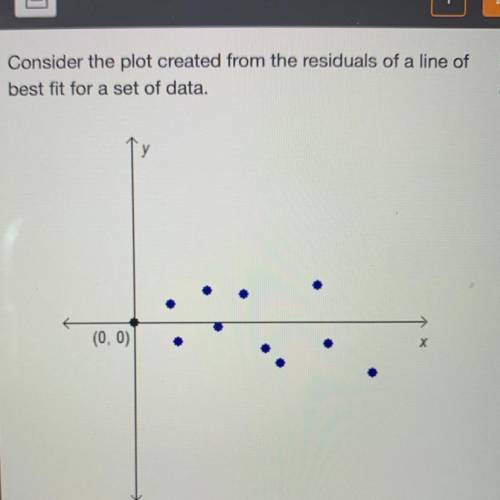
Consider the plot created from the residuals of a line of best fit for a set of data. Does the residual plot show that the line of best fit is appropriate for the data?
A) Yes, the points have no pattern.
B) No, the points are evenly distributed about the x-axis.
C) No, the points are in a linear pattern.
D) Yes, the points are in a curved pattern.
i know 100% the answer isn’t B or D!

Answers: 3


Another question on Mathematics
Mathematics, 21.06.2019 18:00
If a translation of t-3,-8(x, y) is applied to square abcd what is the y-coordinate of b'? the y-coordinate of is 43 mark this and return save and exit next submit
Answers: 1
Mathematics, 21.06.2019 21:50
What is the next step in the given proof? choose the most logical approach. a. statement: m 1 + m 2 + 2(m 3) = 180° reason: angle addition b. statement: m 1 + m 3 = m 2 + m 3 reason: transitive property of equality c. statement: m 1 = m 2 reason: subtraction property of equality d. statement: m 1 + m 2 = m 2 + m 3 reason: substitution property of equality e. statement: 2(m 1) = m 2 + m 3 reason: substitution property of equality
Answers: 3
Mathematics, 21.06.2019 23:30
Find measure angle 1 and measure angle 3 in the kite the diagram is not drawn on the scale
Answers: 1
Mathematics, 21.06.2019 23:50
The functions f(x) and g(x) are shown in the graph f(x)=x^2 what is g(x) ?
Answers: 2
You know the right answer?
Consider the plot created from the residuals of a line of best fit for a set of data. Does the resid...
Questions
Mathematics, 12.09.2021 20:30
Mathematics, 12.09.2021 20:30
Mathematics, 12.09.2021 20:30


Biology, 12.09.2021 20:30

History, 12.09.2021 20:40
Mathematics, 12.09.2021 20:40

English, 12.09.2021 20:40

Biology, 12.09.2021 20:40

Chemistry, 12.09.2021 20:40
Chemistry, 12.09.2021 20:40
English, 12.09.2021 20:40
Mathematics, 12.09.2021 20:40
Physics, 12.09.2021 20:40


