
Mathematics, 25.03.2021 20:40 Reagan650
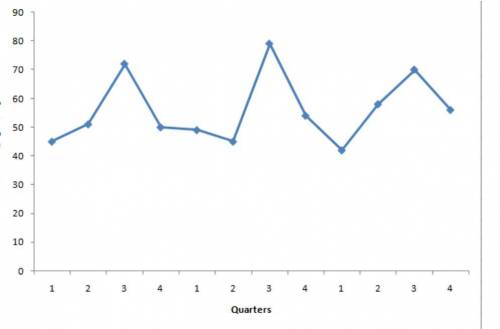
The following data shows the quarterly profit (in thousands of dollars) made by a particular company in the past 3 years.
Year Quarter Profit ($1000s)
1 1 45
1 2 51
1 3 72
1 4 50
2 1 49
2 2 45
2 3 79
2 4 54
3 1 42
3 2 58
3 3 70
3 4 56
Required:
a. Construct a time series plot. What type of pattern exists in the data?
b. Develop a three-period moving average for this time series. Compute MSE and a forecast of profit (in $1000s) for the next quarter.

Answers: 1


Another question on Mathematics
Mathematics, 21.06.2019 21:30
Mis the midpoint of rq if rm equals 2x + 5 and mq equals 4x - 9 what is the length of rq
Answers: 1
Mathematics, 21.06.2019 21:30
Hannah paid $3.20 for 16 ounces of potato chips. hank paid $3.23 for 17 ounces of potato chips. who paid less per ounces?
Answers: 1
Mathematics, 21.06.2019 23:20
Find the value of x in the diagram below. select the best answer from the choices provided
Answers: 1
You know the right answer?
The following data shows the quarterly profit (in thousands of dollars) made by a particular company...
Questions


Mathematics, 02.12.2021 08:50


Geography, 02.12.2021 08:50
English, 02.12.2021 08:50
Mathematics, 02.12.2021 08:50
Mathematics, 02.12.2021 08:50
Mathematics, 02.12.2021 08:50
Physics, 02.12.2021 08:50
History, 02.12.2021 08:50


